

Logs are often the first place administrators look when a Linux server starts behaving unexpectedly. The challenge is finding useful information among thousands of entries generated by applications, services, authentication processes, and the operating system.
AI can make this process easier. Instead of manually reading every entry, you can use an AI model to group similar errors, explain unfamiliar messages, identify unusual patterns, and suggest commands for further investigation. However, sending an entire log file to an AI assistant is rarely a good approach. Large files can exceed a model’s context window, expose sensitive information, and produce inaccurate summaries.
A better approach combines traditional Linux log analysis tools with AI. First, filter and organize the logs using commands such as journalctl, grep, and sed. Then remove sensitive information, send a smaller sample to an AI model, and verify its findings against the original entries.
This guide explains how to analyze Linux log files with AI, find errors, identify unusual messages, and build a simple AI-powered log analyzer using Ollama.
Table of Content
- What AI Can and Cannot Do in Linux Log Analysis
- Where to Find Linux System Logs
- Step 1: Filter Linux Logs Before Sending Them to AI
- Step 2: Remove Sensitive Information Before AI Analysis
- Step 3: Choose an AI Log Analysis Tool
- Step 4: Write a Prompt That Produces Verifiable Findings
- Step 5: Build a Simple AI Log Analyzer With Ollama
- Step 6: Verify AI Findings Against Original Logs
- Linux Log Analysis Tools That Work Alongside AI
- Common Mistakes to Avoid During AI Log Analysis
- Final Thoughts
- Frequently Asked Questions
The Short Answer: How to Analyze Linux Logs With AI
To analyze Linux logs with AI:
- Collect relevant entries using journalctl or grep.
- Filter logs by service, time range, and severity.
- Normalize and group repeated messages to reduce unnecessary data.
- Remove sensitive information such as email addresses and tokens.
- Send the cleaned output to a local LLM or a trusted hosted AI assistant.
- Ask the model to explain errors and quote the exact evidence behind each finding.
- Verify every explanation against the original Linux log entries.
This approach combines the accuracy of traditional log analysis commands with the ability of AI to interpret complex messages.
What AI Can and Cannot Do in Linux Log Analysis
AI can help administrators understand large volumes of log information, but it should not replace traditional diagnostic tools. For example, an AI model can group similar error messages, explain unfamiliar system events, suggest possible causes, and organize findings into a readable report.
However, models can miscount repeated entries, overlook individual messages in large files, or make incorrect assumptions about a server environment.
Task | Best approach |
|---|---|
Filter logs by time or service | journalctl |
Search for specific errors | grep or journalctl –grep |
Count repeated messages | sort and uniq -c |
Identify new message patterns | comm |
Explain unfamiliar errors | AI assistant or local LLM |
Verify a suspected problem | Original logs and Linux diagnostic commands |
Produce a readable summary | AI with structured output |
The practical rule is simple: use Linux commands to collect and count log data, and use AI to explain and organize it.
Where to Find Linux System Logs
Before using AI log analysis tools, you need to identify the correct log source. Linux distributions store system and application logs in different locations.
The following table covers common Linux system logs and their locations.
Log source | Where to look | What it contains |
|---|---|---|
systemd journal | journalctl | Service, boot, and kernel messages |
General system log | /var/log/messages on RHEL-based systems; /var/log/syslog on Debian and Ubuntu | General system events |
Authentication logs | /var/log/secure or /var/log/auth.log | Login attempts and sudo activity |
Kernel logs | journalctl -k or dmesg -T | Hardware, driver, and OOM events |
Nginx logs | /var/log/nginx/ | Web server access and error entries |
Apache logs | /var/log/httpd/ | Apache access and error entries |
Audit and SELinux logs | /var/log/audit/audit.log | Audit events and SELinux denials |
The exact files available depend on your Linux distribution and logging configuration. For example, some systems use rsyslog to write traditional text log files, while others rely primarily on the systemd journal.
Where Are journalctl Logs Stored?
The systemd journal can use persistent or temporary storage.
- /var/log/journal/ stores persistent journal data.
- /run/log/journal/ stores runtime journal data, which is normally lost after a reboot.
To check how many boots your system remembers, run:
journalctl --list-boots
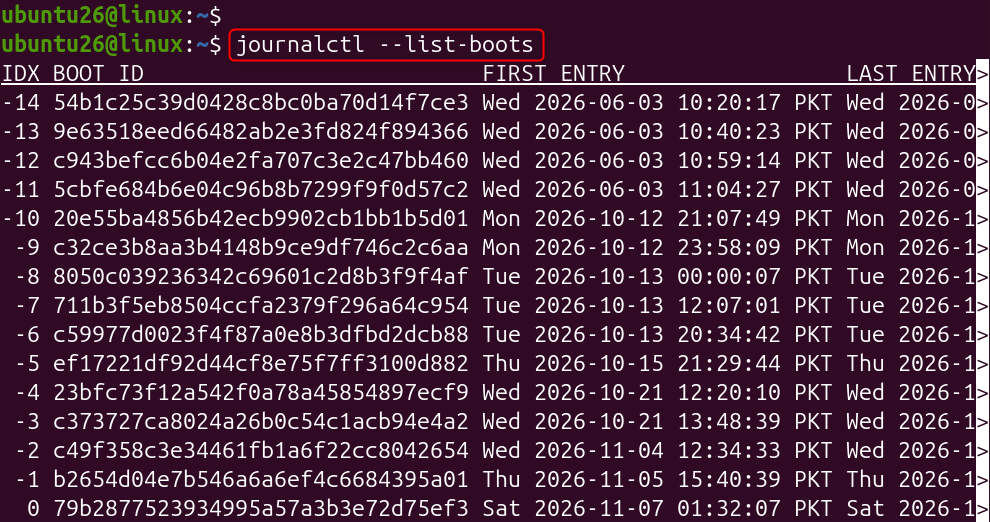
If your journal only contains the current boot, it may be using temporary storage. Persistent storage allows administrators to investigate events from earlier boots.
dmesg vs. journalctl: What Is the Difference?
Both dmesg and journalctl -k help you inspect Linux kernel messages, but they serve slightly different purposes.
- dmesg -T displays kernel messages from the kernel ring buffer with readable timestamps.
- journalctl -k displays kernel messages stored in the systemd journal.
- journalctl -k -b -1 displays kernel messages from the previous boot, if that history is available.
Use dmesg for a quick inspection of recent kernel activity. Use journalctl -k when you need to investigate kernel events across previous boots.
How to Check Rotated Linux Log Files
On systems that write traditional text logs, logrotate periodically renames, compresses, or removes older files.
For example, you might find files such as:
/var/log/messages /var/log/messages-20261012 /var/log/syslog /var/log/syslog.2.gz |
|---|
You can search compressed log files using zgrep:
zgrep -i “error” /var/log/syslog*.gz |
|---|

This is useful when investigating older server problems that are no longer present in the active log file.
Step 1: Filter Linux Logs Before Sending Them to AI
Filtering is one of the most important steps in automated log analysis.
A busy Linux server can generate thousands of entries every hour. Sending all of them to an AI model wastes processing capacity and makes it harder to identify important events.
Start by narrowing the logs by severity, service, and time.
For example, display warnings from the last 24 hours:
journalctl -p warning --since "24 hours ago" --no-pager

To find errors generated by Nginx during the last two hours:
journalctl -u nginx -p err --since "2 hours ago" --no-pager

Useful journalctl Commands for Linux Log Analysis
The following commands help you collect the information needed for further investigation.
  journalctl -n 100 --no-pager
  journalctl -f
  journalctl -u sshd --since "1 hour ago"
  journalctl -b -1 -p err --no-pager
  journalctl --since "2026-10-12 09:00" --until "2026-10-12 10:00"
  journalctl --grep "timeout" --no-pager
  journalctl --list-boots
Here is what each command does:
- -n 100 displays the latest 100 entries.
- -f follows new journal entries, similar to tail -f.
- -u sshd filters messages from the SSH service.
- -b -1 selects the previous boot.
- –since and –until define a time range.
- –grep searches for a specific message.
- –list-boots displays the boot history available in the journal.
You can also use journalctl –utc when you need to compare logs from systems using different time zones.
Identify New Log Messages
Not every repeated warning indicates a new problem. Some messages appear regularly as part of normal server activity. A message that appears for the first time today may deserve closer attention.
You can compare nginx-log’s normalized warnings with yesterday’s:
  journalctl -p warning --since yesterday --until today -o cat --no-pager \ | norm | sort -u > yesterday.txt
  journalctl -p warning --since today -o cat --no-pager \ | norm | sort -u > nginx-log.txt
  comm -13 yesterday.txt nginx-log.txt

The comm -13 command displays message patterns found in nginx-log’s list but not yesterday’s.
This is a simple way to identify new log patterns. It is useful for investigation, but it is not a complete statistical or machine-learning anomaly detection system.
Detect Error Spikes by Hour
A sudden increase in errors can indicate a service problem, resource issue, or application failure.
Instead of asking an AI model to count messages, use awk to group errors by hour:
journalctl -p err --since "24 hours ago" --no-pager -o short-iso \| awk '{print substr($1,1,13)}' \| sort \| uniq -c

The output helps you identify hours with unusually high error activity.
You can then provide the relevant time range to an AI assistant and ask it to explain the associated messages.
Manage Linux Journal Size
A journal that grows continuously can consume significant disk space.
Check its current size:
journalctl --disk-usage

Remove older entries using the vacuum options:
sudo journalctl --vacuum-time=14d

Or limit the journal to a maximum size:
sudo journalctl --vacuum-size=1G

These commands remove older journal entries according to the selected age or size limit. They are preferable to manually deleting journal files.
Step 2: Remove Sensitive Information Before AI Analysis
Linux logs can contain information that should not be shared with external AI services.
Examples include:
- Email addresses
- IP addresses
- Internal hostnames
- Authentication details
- API tokens
- Customer information
Before sending logs to an AI model, remove or replace sensitive values.
For example, the following function masks email addresses and long hexadecimal strings:
redact() { sed -E \ -e ‘s/[A-Za-z0-9._%+-]+@[A-Za-z0-9.-]+/<email>/g’ \ -e ‘s/[A-Fa-f0-9]{32,}/<token>/g’ } |
|---|
These patterns provide basic protection, but they do not identify every type of sensitive information. Passwords, private hostnames, customer names, and other secrets may remain in the output.
Always inspect the filtered logs manually before sharing them.
Step 3: Choose an AI Log Analysis Tool
Once the logs have been filtered and redacted, choose where the AI model will run.
There are two common approaches: a local large language model (LLM) or a hosted AI assistant.
Option 1: Use a Local LLM With Ollama
Ollama allows you to run supported AI models locally. This is useful when you want to analyze private server logs without sending their contents to an external AI service. Keep the Ollama endpoint and model on your own machine or trusted infrastructure, and protect access to the API.
A local model can help with:
- Explaining unfamiliar Linux error messages
- Grouping related warnings
- Summarizing repeated system events
- Suggesting read-only diagnostic commands
- Producing structured log analysis reports
The quality and speed of the response depend on the model and the hardware available.
Option 2: Use a Hosted AI Assistant
A hosted AI assistant may offer stronger reasoning and a simpler interface.
It can be useful when you have a small, carefully redacted sample of logs and want a quick explanation.
However, review the service’s privacy and data-handling policies before sharing server information. Do not upload unredacted production logs or confidential customer data.
Understand the AI Context Window
Every AI model has a context window that limits how much information it can process in one request. A rough estimate is that four characters correspond to one token, although the actual ratio depends on the text and tokenizer.
A deduplicated list of 40 log messages may use only a few thousand tokens, making it easier to analyze than a raw file containing thousands of lines.
When using a local model, configure the context window explicitly where supported. Otherwise, some input may be truncated before analysis.
Step 4: Write a Prompt That Produces Verifiable Findings
The quality of AI log analysis depends partly on how you describe the server and the information you provide.
A vague prompt such as “What is wrong with my server?” may produce generic explanations.
Instead, describe the environment, explain the log format, and ask the model to provide evidence. For example:
This is a Rocky Linux 10 web server running nginx and PostgreSQL. Each line below is a count followed by a normalized log message. Group related messages, rank the groups by severity, and for each group quote the exact line you based it on. If the cause is unclear, say unknown. Suggest one read-only command to confirm each finding. Do not suggest changes. |
|---|
Two instructions are especially important.
First, ask the AI model to quote the exact evidence line. This makes it easier to find the original entry and confirm the explanation.
Second, allow the model to respond with “unknown” when it cannot determine the cause. This reduces the chance of receiving an invented explanation.
Step 5: Build a Simple AI Log Analyzer With Ollama
You can automate the previous steps using a Bash script and the Ollama API.
The following example collects warnings from the last 24 hours, removes selected sensitive values, groups repeated messages, and sends the result to a local model.
It then returns structured JSON containing the severity, summary, evidence, and next diagnostic check.
/usr/local/bin/log-analyze.sh |
|---|
Save the following script as:
#!/bin/bash # Usage: log-analyze.sh nginx set -o pipefail UNIT=”${1:-}” norm() { sed -E \ -e ‘s/[0-9]{1,3}(\.[0-9]{1,3}){3}/<ip>/g’ \ -e ‘s/[0-9a-f]{8}-[0-9a-f-]{27}/<uuid>/g’ \ -e ‘s/[0-9]+/<n>/g’ } redact() { sed -E \ -e ‘s/[A-Za-z0-9._%+-]+@[A-Za-z0-9.-]+/<email>/g’ \ -e ‘s/[A-Fa-f0-9]{32,}/<token>/g’ } # Build journalctl arguments safely. JOURNAL_ARGS=() if [[ -n “$UNIT” ]]; then JOURNAL_ARGS+=(-u “$UNIT”) fi LOGS=$( journalctl “${JOURNAL_ARGS[@]}” \ -p warning \ –since “24 hours ago” \ –no-pager \ -o cat \ | redact \ | norm \ | sort \ | uniq -c \ | sort -rn \ | head -40 ) if [[ -z “$LOGS” ]]; then echo “No matching warning entries found.” exit 0 fi jq -n –arg logs “$LOGS” ‘{ model: “llama3.2”, stream: false, options: { num_ctx: 8192, temperature: 0 }, prompt: ( “Each line is a count and a normalized Linux log message. ” + “Group related messages, rank by severity, quote the exact evidence line, ” + “and say unknown if the cause is unclear. Do not suggest changes.\n\n” + $logs ), format: { type: “object”, required: [“findings”], properties: { findings: { type: “array”, items: { type: “object”, required: [“severity”, “summary”, “evidence”, “next_check”], properties: { severity: { type: “string”, enum: [“low”, “medium”, “high”] }, summary: { type: “string” }, evidence: { type: “string” }, next_check: { type: “string” } } } } } } }’ | curl -fsS http://localhost:11434/api/generate -d @- \ | jq -r ‘ .response | fromjson | .findings[] | “[\(.severity)] \(.summary)\n evidence: \(.evidence)\n check: \(.next_check)\n” ‘ |
|---|

This script uses a Bash array for the optional service argument, which avoids problems when the service name contains special characters or spaces.
Make the Script Executable
Run:
sudo chmod +x /usr/local/bin/log-analyze.sh |
|---|

Test it manually:
/usr/local/bin/log-analyze.sh nginx |
|---|
The script assumes that Ollama is running locally, the selected model is available, and the account running the script has permission to read the journal.
You can use a different model by changing:
model: “llama3.2” |
|---|
A smaller model such as Llama 3.2 with 3 billion parameters may respond quickly but provide less detailed explanations. Larger models may offer stronger reasoning if your hardware supports them.
Schedule Daily AI Log Analysis
After testing the script, you can schedule it to run every morning using cron.
For example:
echo ‘0 7 * * * airead /usr/local/bin/log-analyze.sh nginx >> /home/airead/daily-report.txt 2>&1’ \ | sudo tee /etc/cron.d/ai-log-report |
|---|

This schedules the script to run at 7:00 AM every day as the airead account.
Make sure that:
- The airead account exists.
- It has the required permission to read the system journal.
- Ollama is available when the scheduled task runs.
- The report directory is writable by the account.
- The account has access only to the resources it needs.
Using a restricted account helps limit the impact of mistakes and keeps routine log analysis separate from administrative changes.
Step 6: Verify AI Findings Against Original Logs
Never treat an AI-generated explanation as a confirmed diagnosis.
Every finding should be checked against the original Linux system logs.
For example, if the AI reports repeated connection failures, search for the relevant message:
journalctl --since "24 hours ago" \ --grep "connection refused" \ --no-pager \| head

Then confirm:
- Whether the quoted message actually exists.
- Whether the timestamp matches the reported issue.
- Whether the message frequency is accurate.
- Whether the suggested diagnostic command is appropriate for your distribution.
- Whether other system events provide additional context.
Use uniq -c or awk for exact counts instead of asking the AI model to calculate them.
If the model suggests a possible fix, research the issue and verify the solution against the relevant distribution or application documentation before making changes.
For a safer troubleshooting workflow, see our guide on using ChatGPT to troubleshoot Linux server errors.
Linux Log Analysis Tools That Work Alongside AI
AI is useful, but it does not replace established Linux log analysis tools.
Different tools serve different purposes, and many administrators use several together.
Tool | Main purpose |
|---|---|
journalctl | Inspect systemd journal entries |
grep | Search text logs for specific patterns |
lnav | Browse and search logs in the terminal, including SQL queries |
GoAccess | Analyze web server logs |
Logwatch | Generate daily log summaries |
Respond to repeated authentication failures | |
Loki with Grafana | Centralize and explore log data |
Graylog | Collect, search, and manage log information |
Elastic | Search and analyze centralized log data |
Some observability platforms offer AI-assisted summaries or anomaly-detection features, depending on the product and subscription tier. Check the features available in your version before building a separate solution.
The best approach is to use traditional Linux log analysis tools for collection, filtering, and exact searches, then add AI where explanations and summaries save time.
Common Mistakes to Avoid During AI Log Analysis
Even a useful AI workflow can produce unreliable results if the underlying process is poorly designed. Avoid these common mistakes.
1. Sending entire log files to AI
Large files can exceed the model’s context window and make relevant errors harder to identify. Filter the logs before analysis.
2. Asking AI to count errors
Models can miscount repeated messages. Use uniq -c, awk, or other deterministic tools for exact totals.
3. Ignoring time-zone differences
Linux journal entries may use local time, while other systems may record timestamps in UTC. Use journalctl –utc when correlating events across servers.
4. Skipping data redaction
Logs may contain sensitive information. Apply redaction and inspect the output before sharing it with any external service.
5. Analyzing too much historical data at once
A full month of logs may contain more information than an AI model can process reliably. Work with hourly or daily windows and compare the results.
6. Trusting explanations without evidence
A plausible explanation is not necessarily a correct one. Ask the model to quote the exact log entry and verify it against the original source.
Final Thoughts
AI log analysis can make Linux server troubleshooting faster and easier, especially when a system generates thousands of log entries every day. However, the most reliable results come from combining AI with traditional Linux tools. Filter messages by time and priority, normalize repeated patterns, remove sensitive information, and let the model explain the remaining entries.
Use commands such as journalctl, grep, sort, and uniq -c for accurate log collection and counting. Use an AI assistant or a local Ollama model to interpret messages, organize findings, and suggest further diagnostic checks. Most importantly, verify every AI-generated explanation against the original logs before making a decision.
Start with a daily log summary for one service, compare the findings with what you already know about the server, and expand the workflow once you are confident in its results.
Frequently Asked Questions
1. Can ChatGPT analyze Linux log files?
Yes. ChatGPT can help explain Linux log entries, group related errors, and summarize a filtered sample. It cannot directly access your server unless you provide the relevant data through an available integration. For better results, filter and redact the logs before sharing them, and ask the model to quote the evidence behind its findings.
2. How do I analyze Linux logs with AI without sending data to the cloud?
You can use a local large language model with Ollama. Collect and filter the relevant Linux log entries, then send the cleaned output to a model running on your own machine or trusted infrastructure. Keep the API endpoint local and protect access to it. You should still remove sensitive information before storing or sharing the output.
3. What is the best way to find errors in Linux logs?
Use journalctl -u to inspect a specific service or grep to search for a particular message. Then group repeated entries using sort | uniq -c. This helps identify common errors. You can use AI afterward to explain the remaining messages.
4. How much of a log file can I give an AI model at once?
It depends on the model’s context window. As a rough estimate, four characters equal one token, although the actual ratio varies. Reduce unnecessary log entries, work with smaller time windows, and configure the context size explicitly when using a local model.
5. Can AI automatically detect anomalies in Linux logs?
AI can help identify unusual log patterns, explain new messages, and summarize changes in system activity. For example, you can compare today’s normalized messages with yesterday’s using comm or inspect hourly error counts using awk. These methods provide basic pattern detection, while dedicated observability platforms may offer more advanced anomaly-detection capabilities. Both approaches can produce false positives, so verify the results.


Leave feedback about this