Monitor PostgreSQL’s performance to ensure your applications are fast, reliable, and scalable. Using pgAdmin to analyze the performance of your database is easy and effective if you run PostgreSQL under Ubuntu 24.04. pgAdmin has official support, is free, and simple to use. Dashboards, query analyses, and statistics are all available in a single interface. Review logs and monitor performance frequently. Optimize queries and add indexes as needed. Scale resources according to usage trends.
This guide will explain how to monitor PostgreSQL with pgAdmin in Ubuntu 24.04, including installation commands. You’ll also learn about performance dashboards, analysis of slow queries, and optimization techniques.
Table of Content
What is pgAdmin?
pgAdmin, the official PostgreSQL management and monitoring software, is an open-source tool. It offers a web-based interface for monitoring database activity, performance metrics, and queries. By using pgAdmin, you can monitor PostgreSQL’s performance more visually and easily. PostgreSQL monitoring can help identify resource bottlenecks, slow queries, and excessive connections. You can improve system performance by tracking database metrics in real-time.
How to Monitor PostgreSQL Performance with pgAdmin
Monitor PostgreSQL with pgAdmin to maintain a high-performing database. With the pgAdmin dashboards and query tools, as well as statistics views, you are able to detect problems early and optimize your database.
Prerequisites
Before you begin, make sure your environment meets these requirements. Installing pgAdmin requires Ubuntu 24.04 with PostgreSQL running and installed, sudo access, and an Internet connection.
Step 1: Update Ubuntu 24.04 System
Update your system first before installing any new software.
|
sudo apt update |
|---|

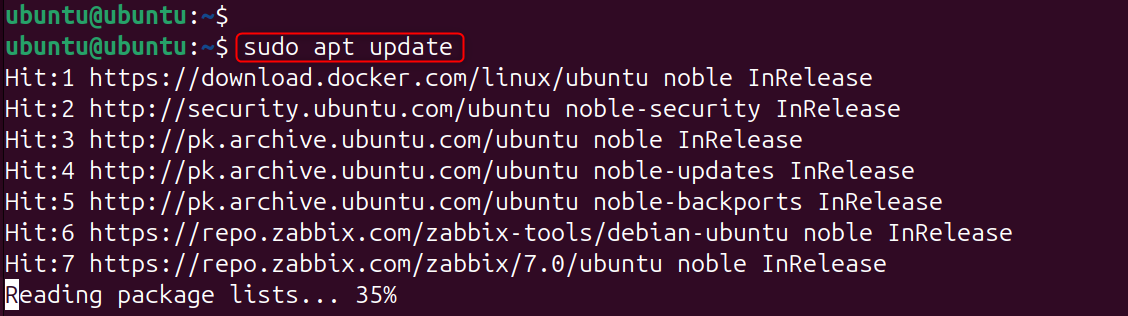
Update your system to ensure you have the most recent security patches and dependencies. This will prevent compatibility problems during PostgreSQL installation and pgAdmin.
Step 2: Install PostgreSQL on Ubuntu 24.04
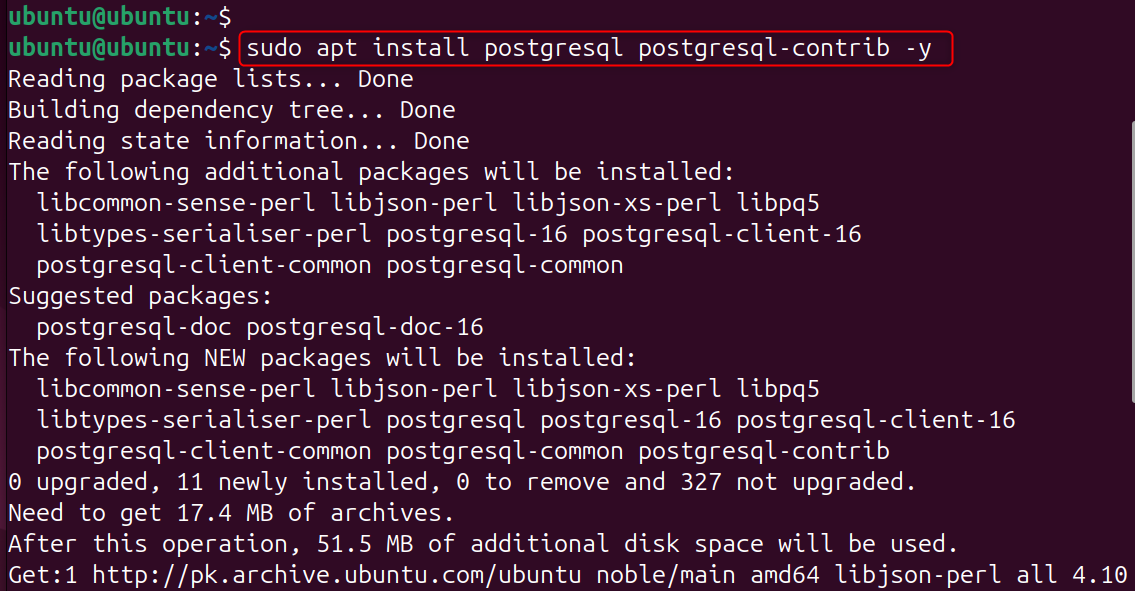
Install PostgreSQL using the following command.
|
sudo apt install postgresql postgresql-contrib -y |
|---|

Verify the service status:
|
sudo systemctl status postgresql |
|---|

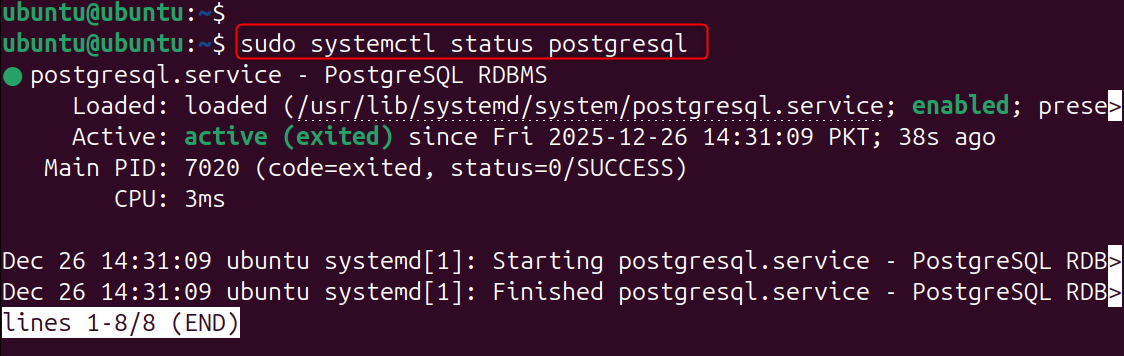
Additional utilities for database management are also installed. Status check confirms that PostgreSQL is running properly.
Step 3: Install pgAdmin on Ubuntu 24.04
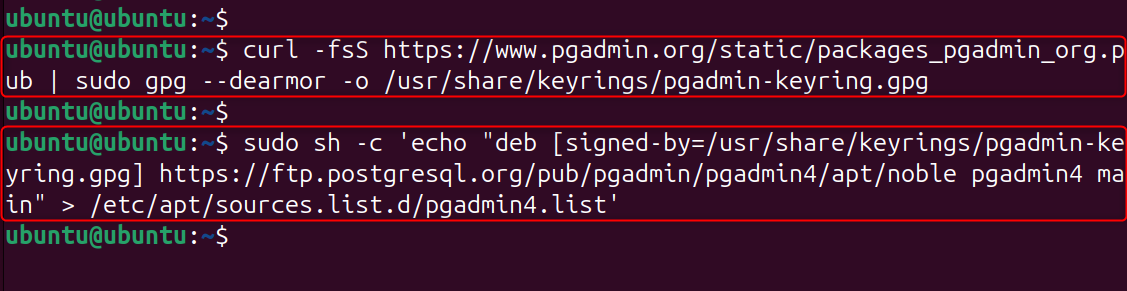
Install pgAdmin4 after adding the official repository of pgAdmin.
|
curl -fsS https://www.pgadmin.org/static/packages_pgadmin_org.pub | sudo gpg –dearmor -o /usr/share/keyrings/pgadmin-keyring.gpg sudo sh -c ‘echo “deb [signed-by=/usr/share/keyrings/pgadmin-keyring.gpg] https://ftp.postgresql.org/pub/pgadmin/pgadmin4/apt/noble pgadmin4 main” > /etc/apt/sources.list.d/pgadmin4.list’ |
|---|

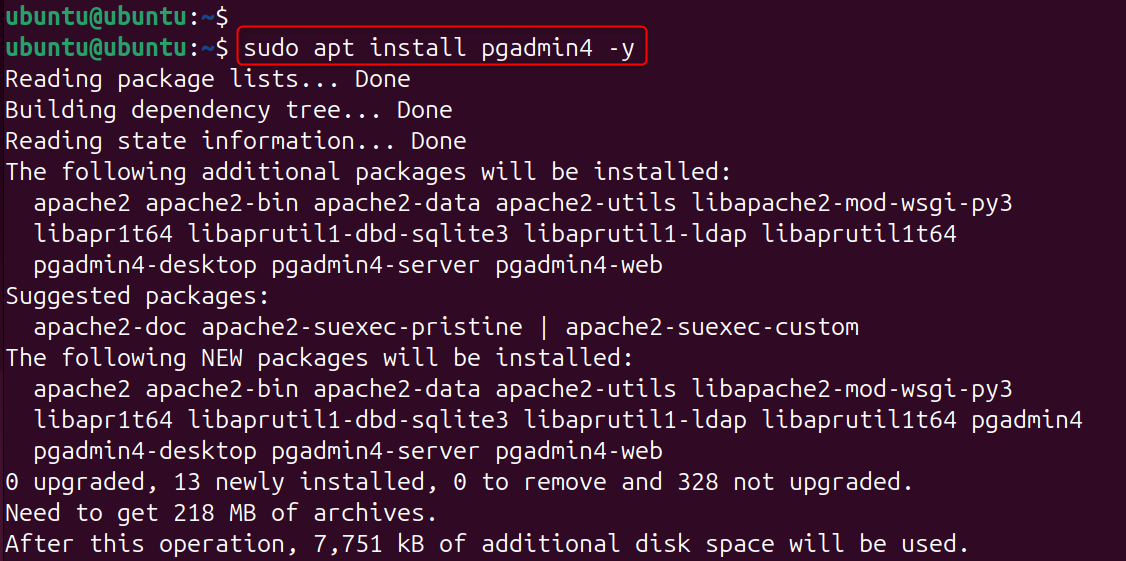
The installation of PostgreSQL is completed.
|
sudo apt install pgadmin4 -y |
|---|

Configure pgAdmin:
|
sudo /usr/pgadmin4/bin/setup-web.sh |
|---|

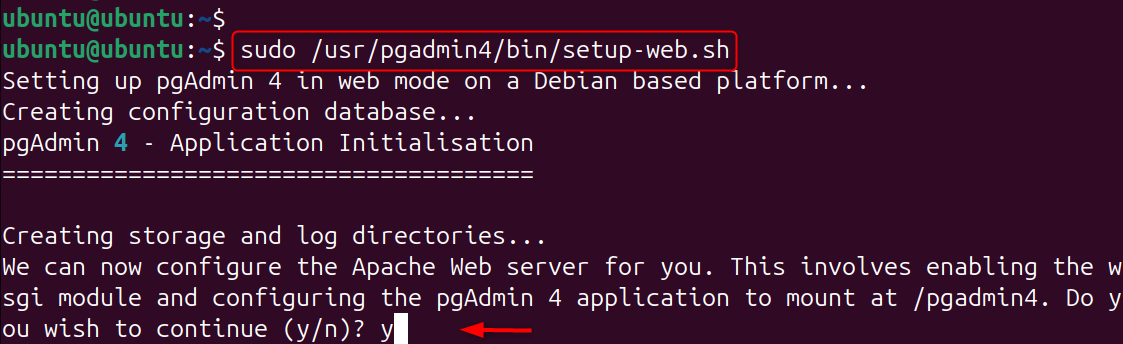
This script installs and configures pgAdmin as a web-based application. The setup script prepares pgAdmin to be accessed via browser by creating login credentials.
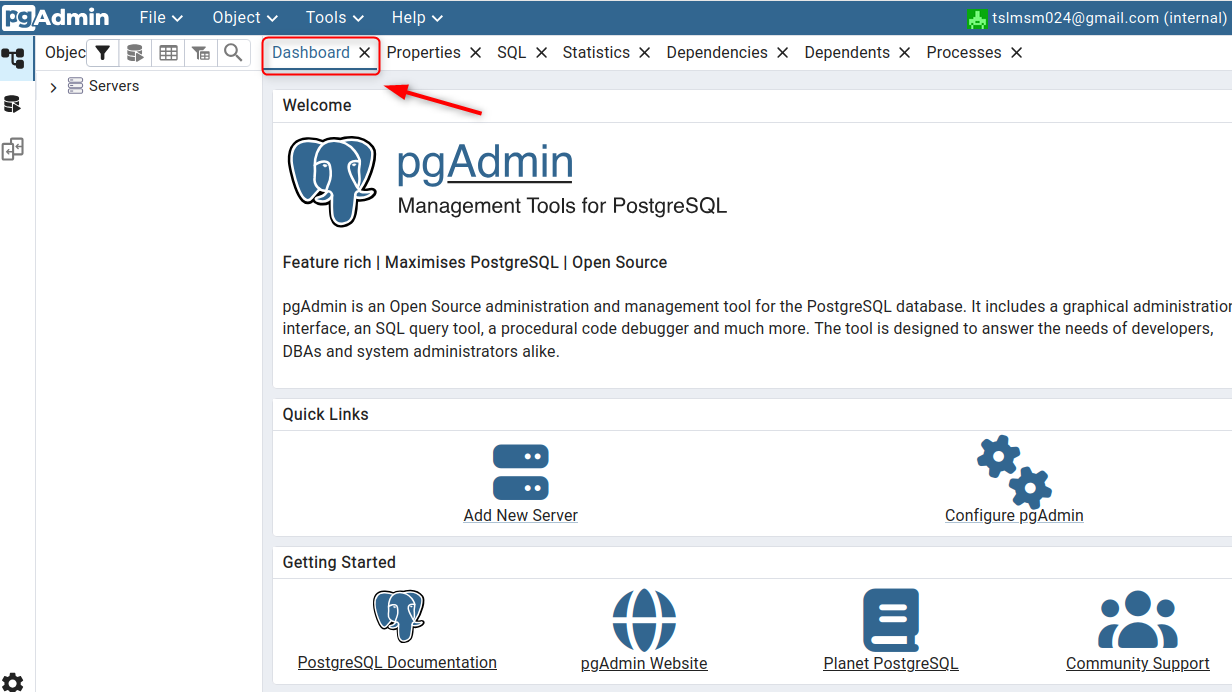
Step 4: Access pgAdmin Web Interface
Open your browser and access pgAdmin. Log in using the email and password set during installation.
|
http://localhost/pgadmin4 |
|---|
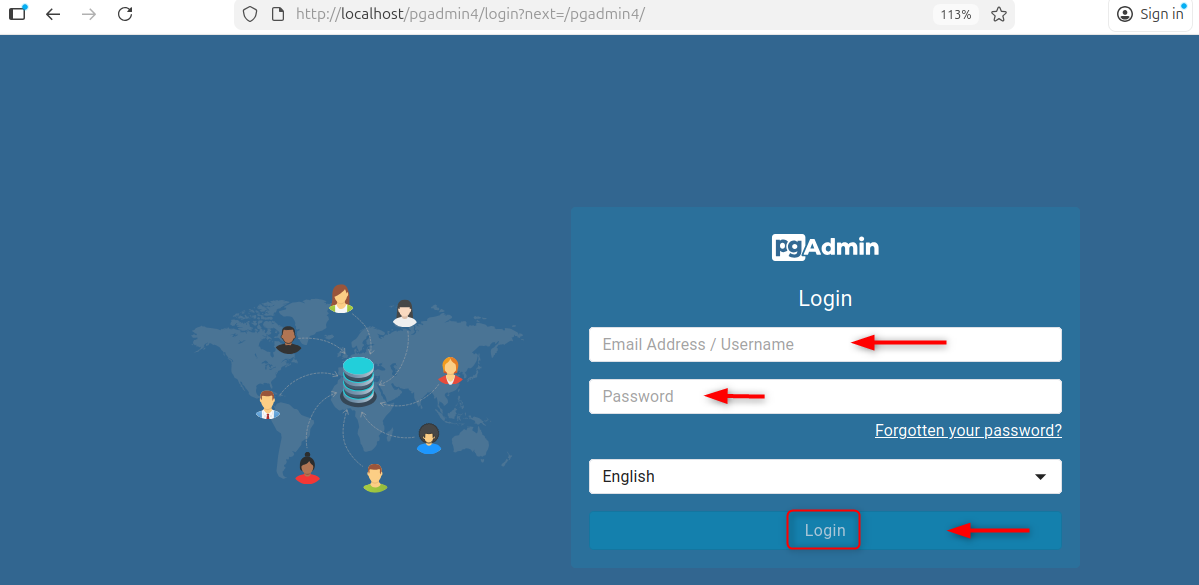
The pgAdmin Web interface provides centralized PostgreSQL Monitoring. Logging in gives you access to dashboards and statistics as well as query tools.

Step 5: Connect pgAdmin to PostgreSQL Server
In pgAdmin, register a new server by providing database credentials. Enter the hostname, port (5432), username, and password.
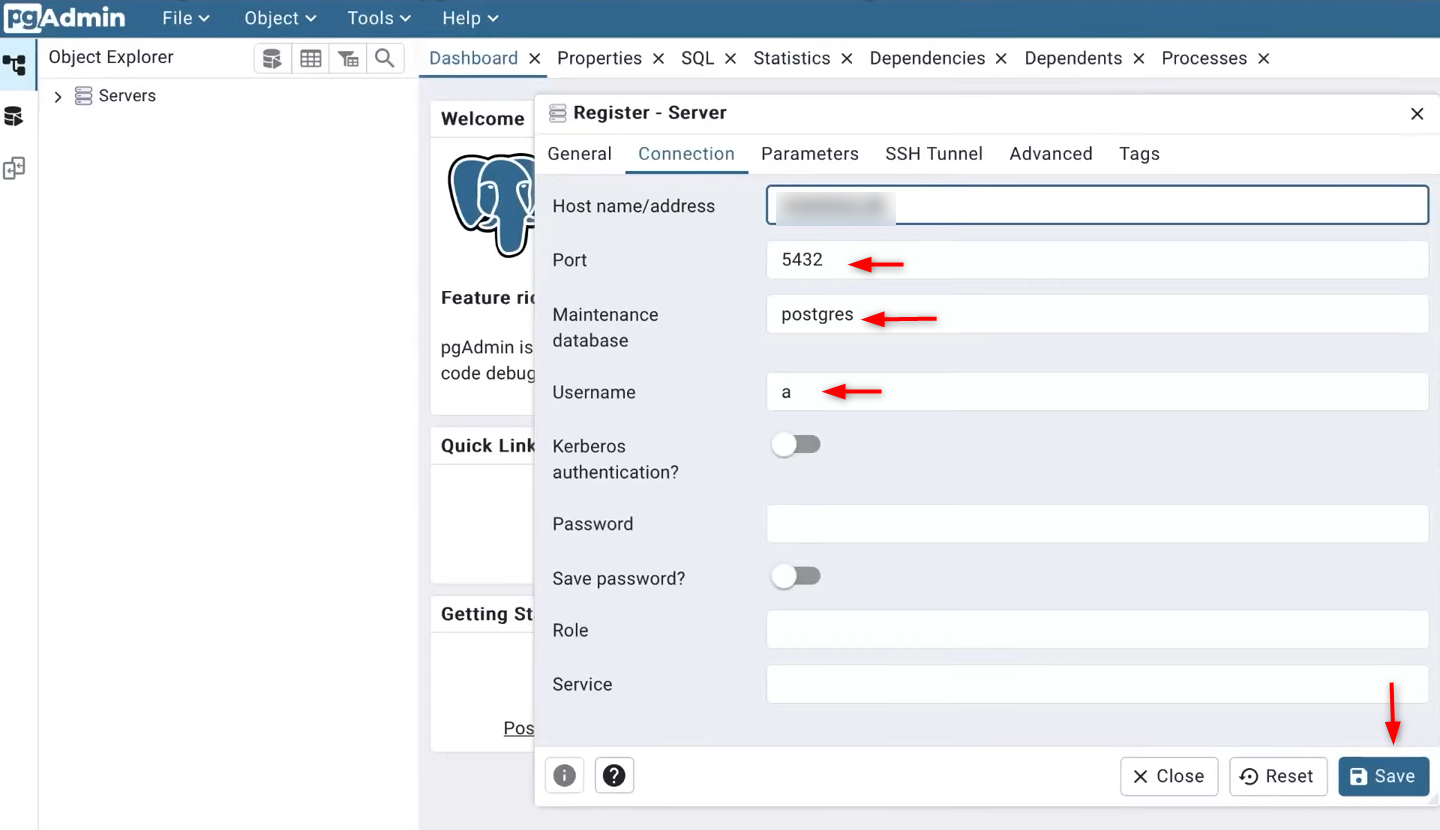
Connecting pgAdmin with PostgreSQL allows for real-time monitoring of performance. Without this connection, pgAdmin can’t retrieve database statistics.

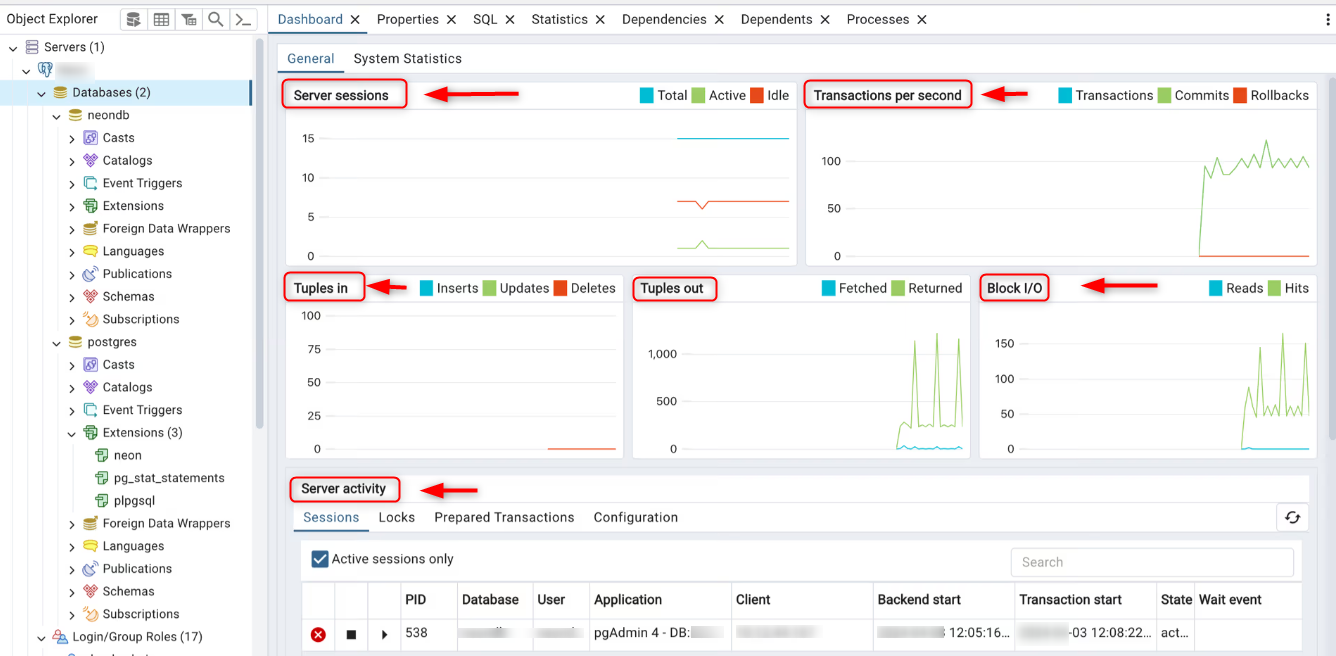
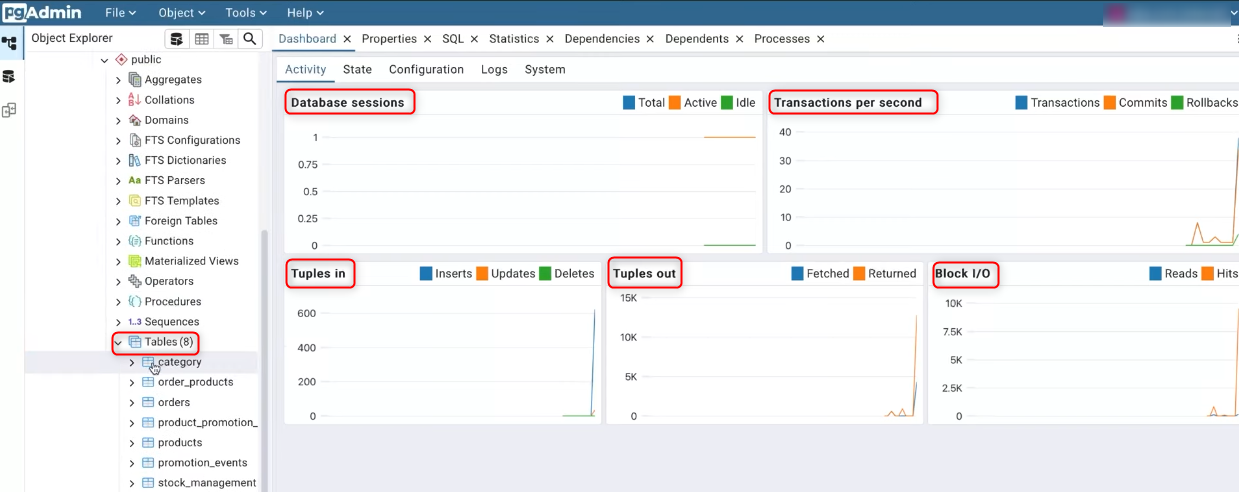
Step 6: Use pgAdmin Dashboard for Performance Monitoring
Open the Dashboard by selecting your PostgreSQL Server.

Monitor database activity, including sessions, transactions, tuples, and graphs. Dashboard provides an overview of PostgreSQL’s performance in real time. It allows you to quickly detect abnormal activity spikes and drops.
Step 7: Monitor Active Sessions and Connections
Navigate to Databases under the Dashboard section. Check for active, idle, and long-running connections.

Step 8: Analyze Query Performance Using Query Tool
Open the Query tool in pgAdmin to analyze queries.
|
select * from category; |
|---|

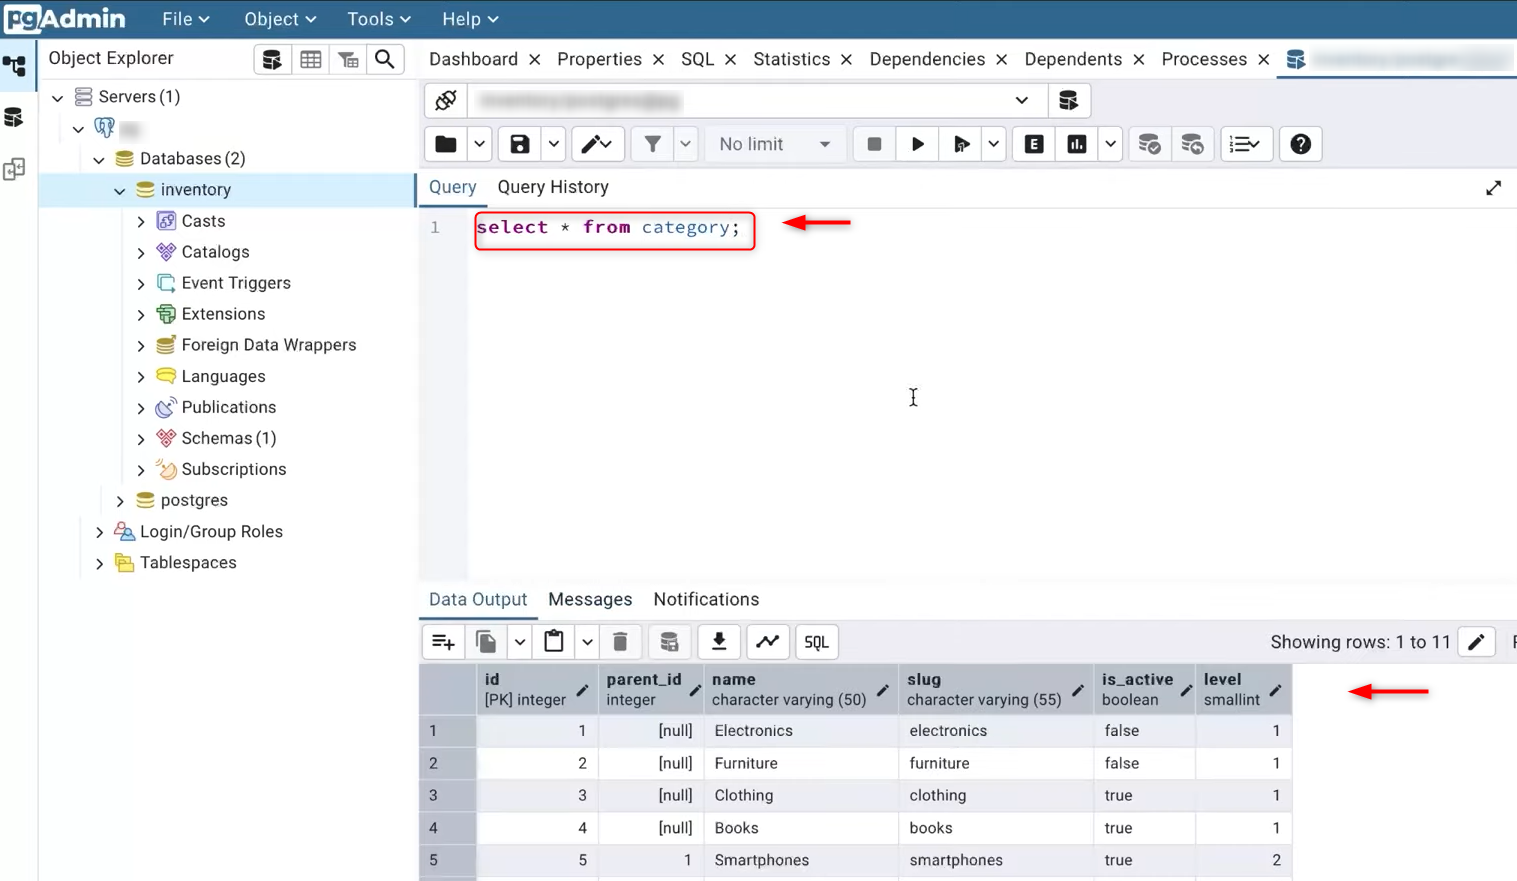
This command demonstrates how PostgreSQL queries are executed internally. This command helps to identify slow operations or missing indexes.
Step 9: Enable and Monitor Slow Queries
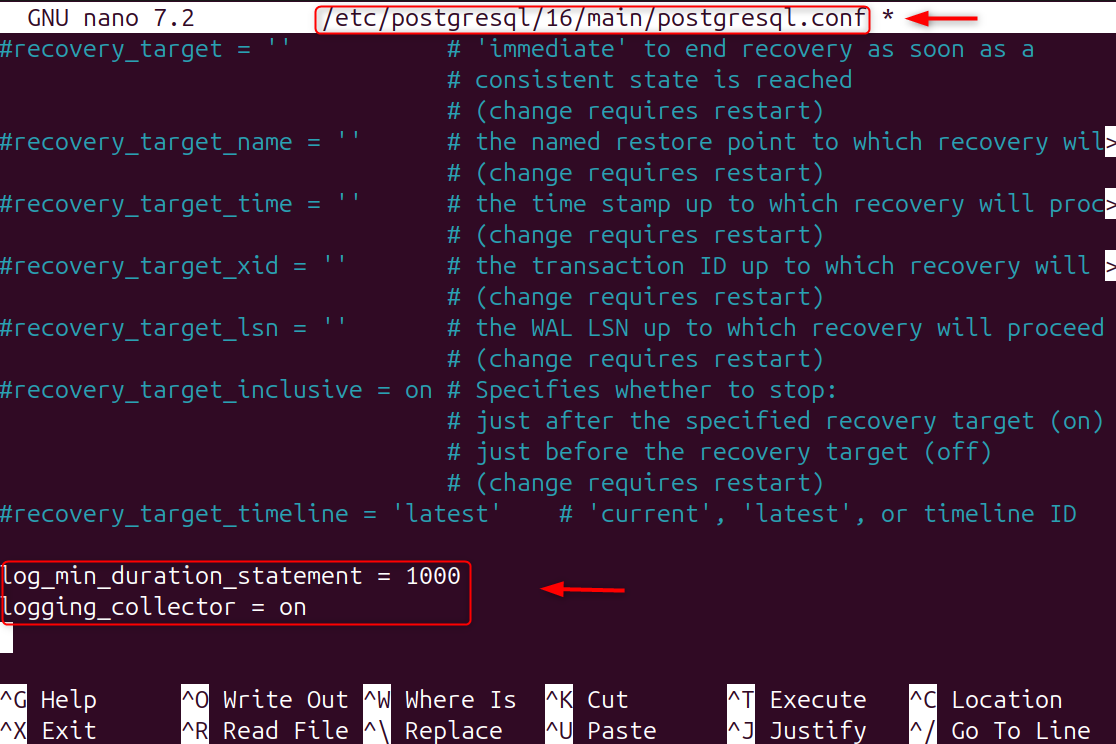
Edit PostgreSQL configuration file:
|
sudo nano /etc/postgresql/16/main/postgresql.conf |
|---|
Set the following values:
|
log_min_duration_statement = 1000 logging_collector = on |
|---|

Restart PostgreSQL:
|
sudo systemctl restart postgresql |
|---|

These log queries take more than one second to complete. Monitoring slow queries helps pinpoint performance bottlenecks.

Step 10: Monitor Index Usage and Table Statistics
In pgAdmin, navigate to Tables. Let’s review sequential scans, index scans, and tuple updates.
This section will help you determine if indexes are being utilized efficiently. Slow query execution can be caused by poor index usage. In pgAdmin statistics, you can check the buffer cache, disk writes, and reads.

By following this guide, you gain complete visibility into PostgreSQL performance and ensure long-term database stability.
Conclusion
To monitor PostgreSQL performance with pgAdmin, install PostgreSQL and pgAdmin, connect pgAdmin to your PostgreSQL server, use the dashboard to monitor sessions and activity, analyze queries with EXPLAIN ANALYZE, enable slow query logging, review index usage and locks, and optimize the database based on collected performance metrics. High disk or memory usage often indicates inefficient queries. Monitoring resource usage helps with PostgreSQL tuning and capacity planning.