
Today, Prometheus is the most popular and widely used open-source monitoring and alerting toolkit for the DevOps community, used by hosting companies to monitor millions of metrics from thousands of servers in real-time. This guide will help you set up a full Prometheus monitoring stack for Ubuntu 24.04 LTS, including the installation of Prometheus, Node Exporter, and learning how to use the PromQL queries.
Table of Content
- What Is Prometheus and How Does It Work?
- How to Configure Prometheus Monitoring: A Step-by-Step Guide
- Troubleshooting Common Issues on Ubuntu
- Best Practices for Prometheus Monitoring on Ubuntu
- Conclusion
What Is Prometheus and How Does It Work?
Prometheus is a time-series database and monitoring system that pulls (scrapes) metrics from endpoints at regular intervals and configured periods. While push-based monitoring tools connect to your infrastructure and applications and wait for metrics to be sent, Prometheus actively seeks out your application and infrastructure, collecting metrics and storing them in a series of numerical values with times of collection that you can query, graph, and alert on.
The main Prometheus architecture of Ubuntu is made up of three parts that function together:
- Prometheus Server: The thinking part of the stack. It gathers metrics from targets and stores them into a time-series database (TSDB), checks alerting rules, and provides a web UI and API on port 9090.
- Node Exporter: A lightweight agent installed on each Linux server and listening on port 9100 for over 1,000 system-level metrics such as CPU, memory, disk, network, and file system usage.
- Grafana: It is a visualization platform that provides beautiful, interactive dashboards from your metrics data on port 3000, and connects to Prometheus as a data source.
How to Configure Prometheus Monitoring: A Step-by-Step Guide
To set Prometheus monitoring up on Ubuntu, install it with sudo apt install prometheus -y, configure /etc/prometheus/prometheus.yml to define your scrape targets, then start the service with sudo systemctl enable prometheus –now to begin collecting metrics on port 9090. Let’s explore the step-by-step instructions.
Step 1: Verify Your System Environment
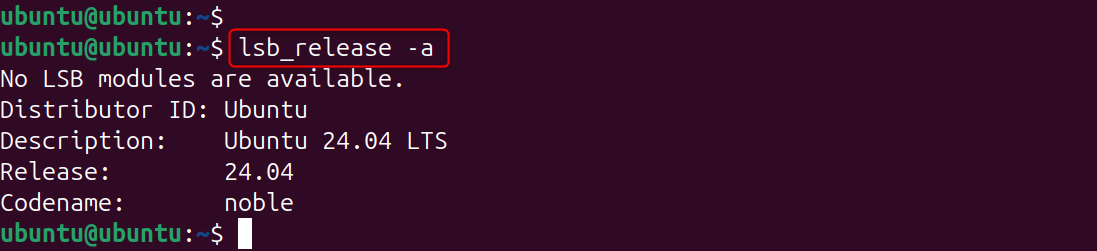
To be safe, check which version of Ubuntu you are running and update package lists prior to installation. To use all commands in this guide, you will need sudo or root access to your Ubuntu server:
|
lsb_release -a |
|---|

Step 2: Install Prometheus on Ubuntu
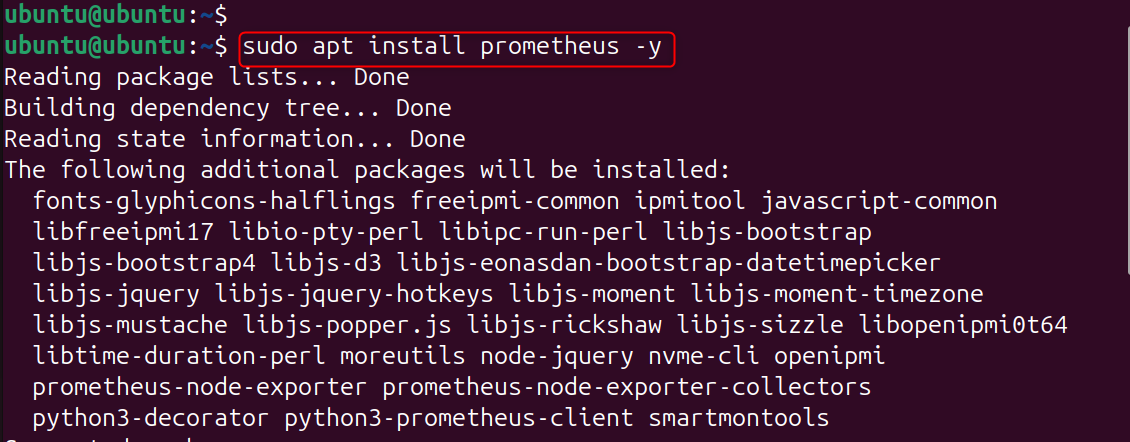
The Prometheus binary is already available in the package repository of Ubuntu 24.04 LTS, so you can just download and install it with apt, without needing to extract a tarball or download the binary yourself:
|
sudo apt install prometheus -y |
|---|

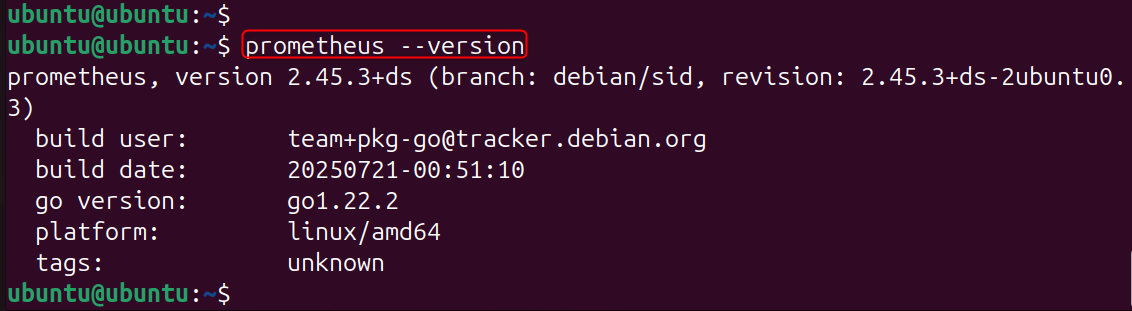
Please check its version to verify that Prometheus was installed correctly:
|
prometheus –version |
|---|

If you are running Prometheus on your local Ubuntu machine, use:
|
which prometheus |
|---|

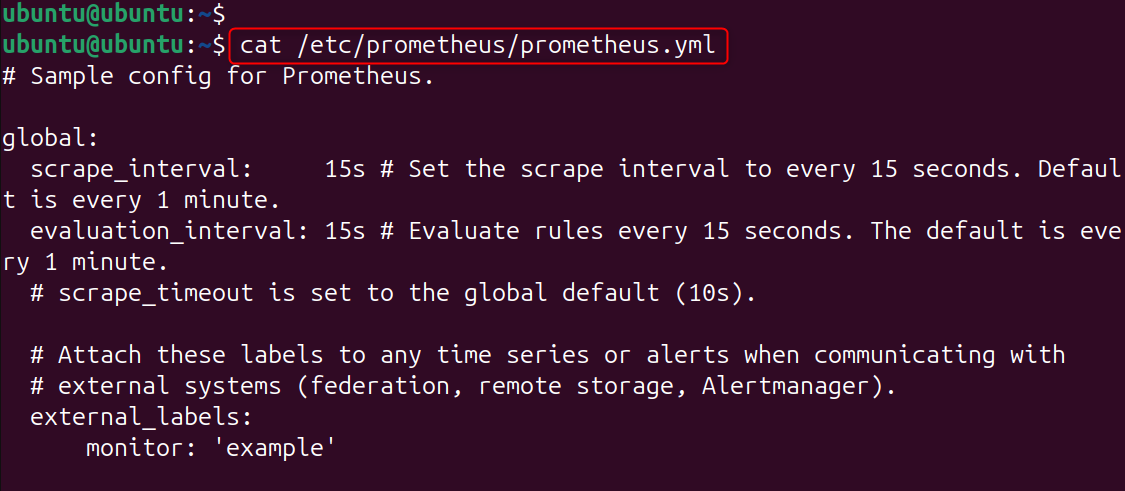
Step 3: Review the Default Configuration File
Prometheus is configured through a YAML file located at /etc/prometheus/prometheus.yml. View its contents to understand the default setup:
|
cat /etc/prometheus/prometheus.yml |
|---|

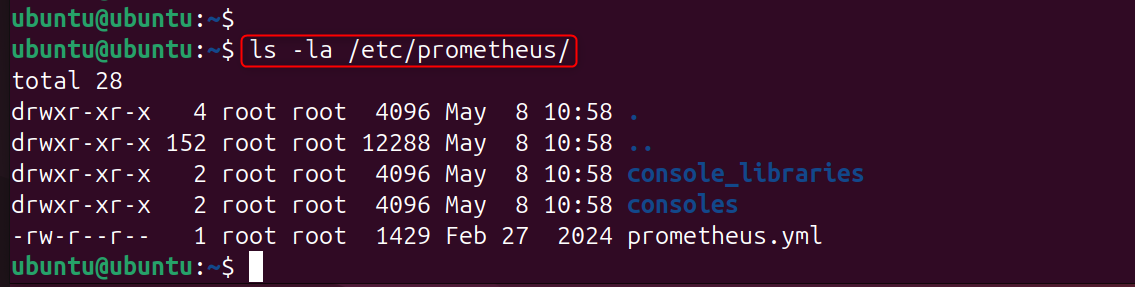
The default configuration directory contains the following files:
|
ls -la /etc/prometheus/ |
|---|

Now update the configuration file to create a clean, production-ready setup. Open the file with your text editor:
|
sudo nano /etc/prometheus/prometheus.yml |
|---|
Replace the contents with this clean configuration:
|
global: scrape_interval: 15s evaluation_interval: 15s scrape_configs: – job_name: ‘prometheus’ scrape_interval: 5s static_configs: – targets: [‘localhost:9090’] – job_name: ‘node’ static_configs: – targets: [‘localhost:9100’] |
|---|

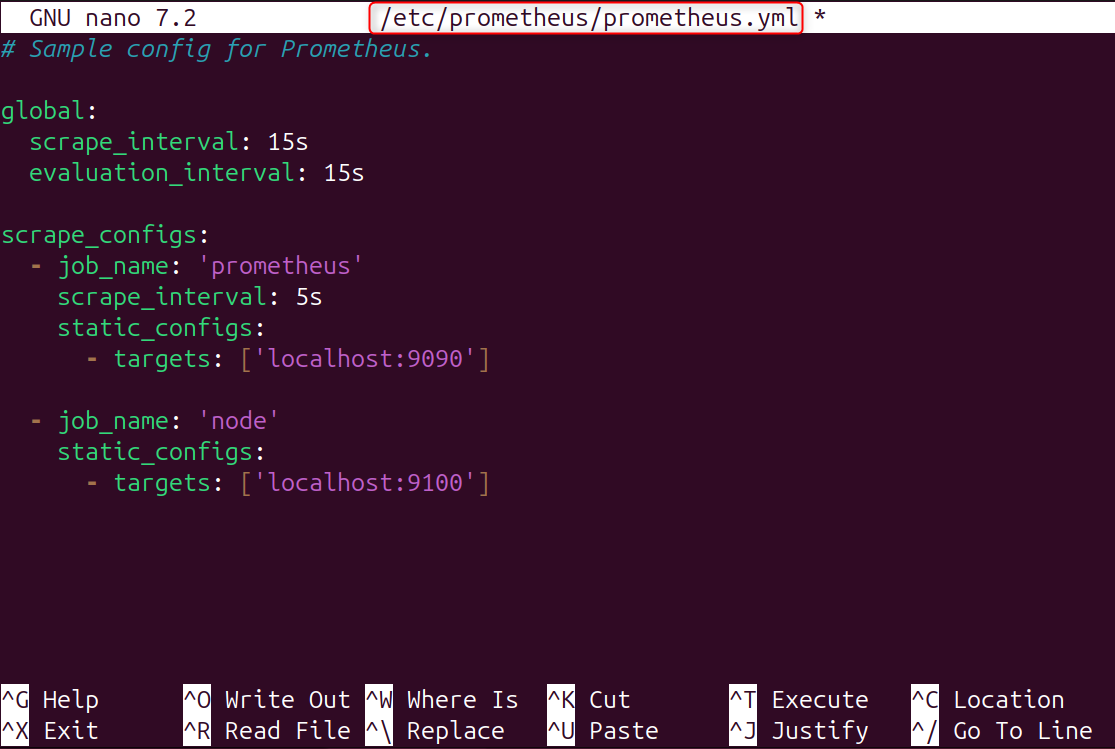
Save and close the file. This configuration tells Prometheus to scrape its own metrics every 5 seconds and to scrape Node Exporter metrics every 15 seconds.
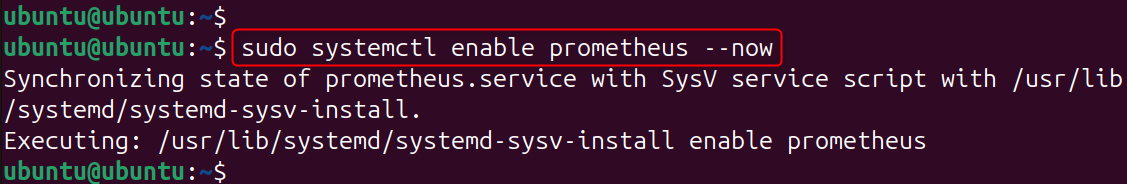
Step 4: Start and Enable the Prometheus Service
Start the Prometheus service and enable it to start automatically at every system boot:
|
sudo systemctl enable prometheus –now |
|---|

Check that the service is running:
|
sudo systemctl status prometheus |
|---|

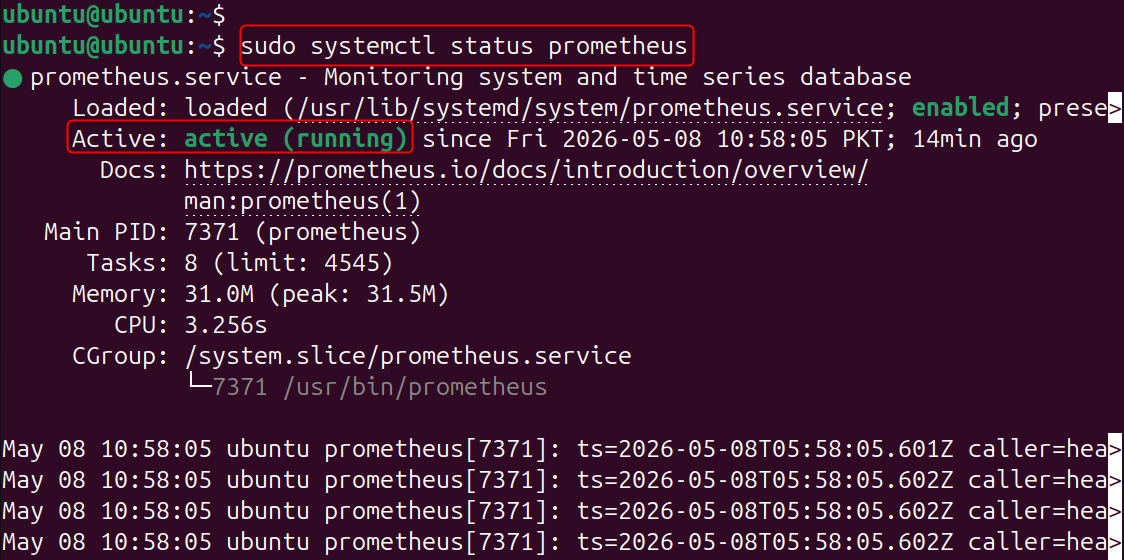
The final line, “Server is ready to receive web requests,” confirms that Prometheus is fully initialized and listening on port 9090.
Verify the health endpoint responds correctly:
|
curl http://localhost:9090/-/healthy |
|---|


Step 5: Install and Start Node Exporter
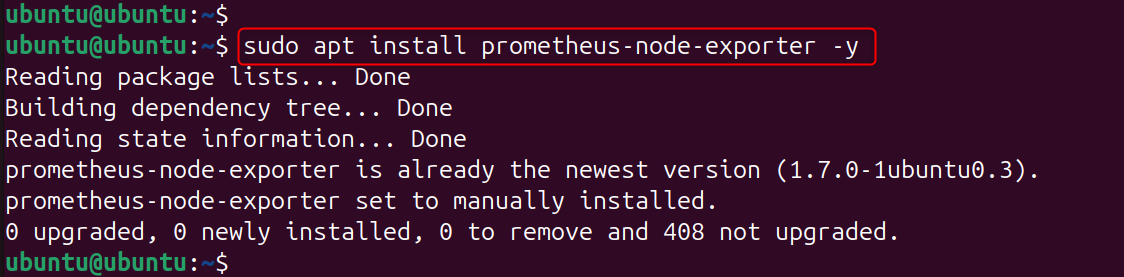
Node Exporter collects over 1,000 hardware and OS-level metrics from your Ubuntu server. Install it using apt:
|
sudo apt install prometheus-node-exporter -y |
|---|

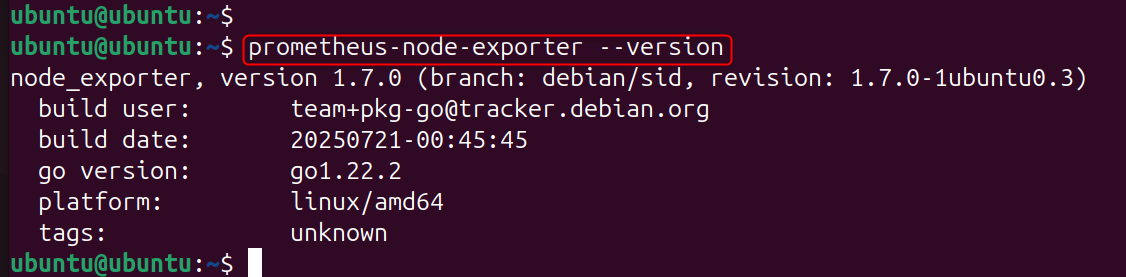
Verify the installation:
|
prometheus-node-exporter –version |
|---|

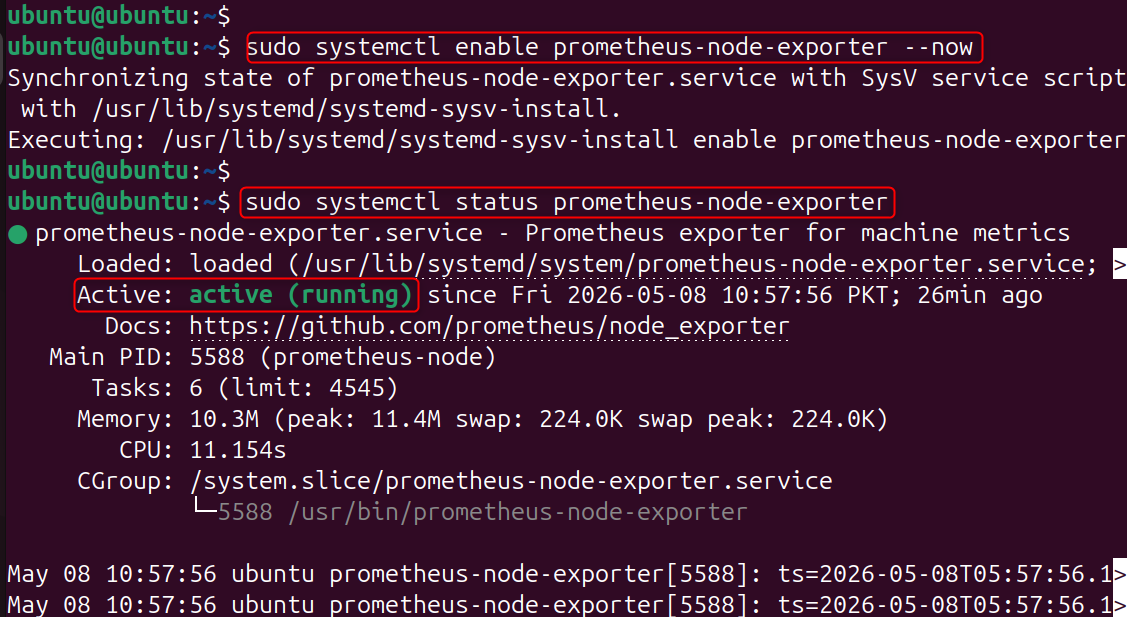
Start and enable the Node Exporter service:
|
sudo systemctl enable prometheus-node-exporter –now sudo systemctl status prometheus-node-exporter |
|---|

Step 6: Verify Node Exporter Is Exposing Real Metrics
Test the Node Exporter metrics endpoint directly from your terminal:
|
curl http://localhost:9100/metrics | head -30 |
|---|

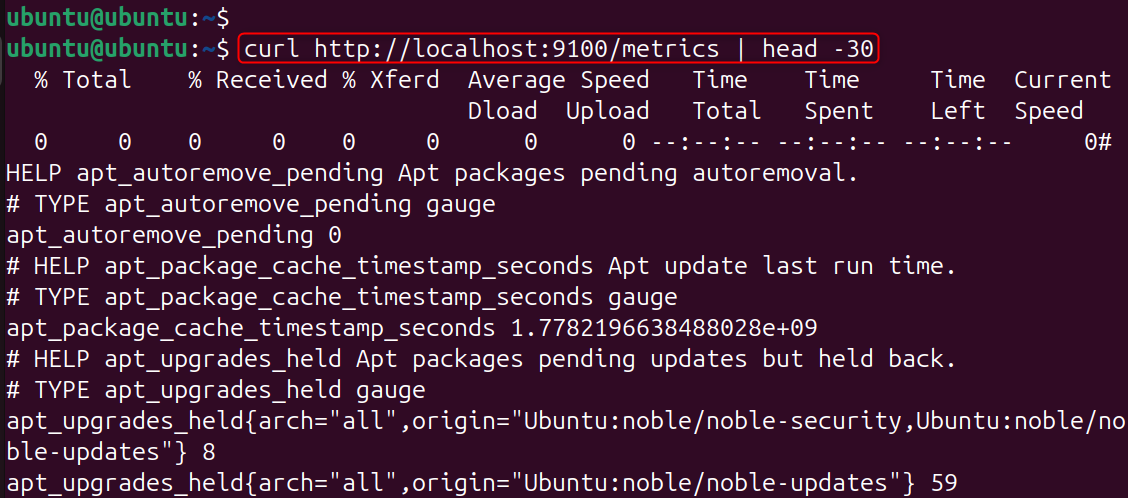
These are real metrics collected from the Ubuntu 24.04.4 LTS system where this blog was written and tested.
Step 7: Access the Prometheus Web UI
Open your web browser and navigate to:
|
http://YOUR_SERVER_IP:9090 |
|---|
If you are running Prometheus on your local Ubuntu machine, use:
|
http://localhost:9090 |
|---|


The Prometheus web UI offers three key views:
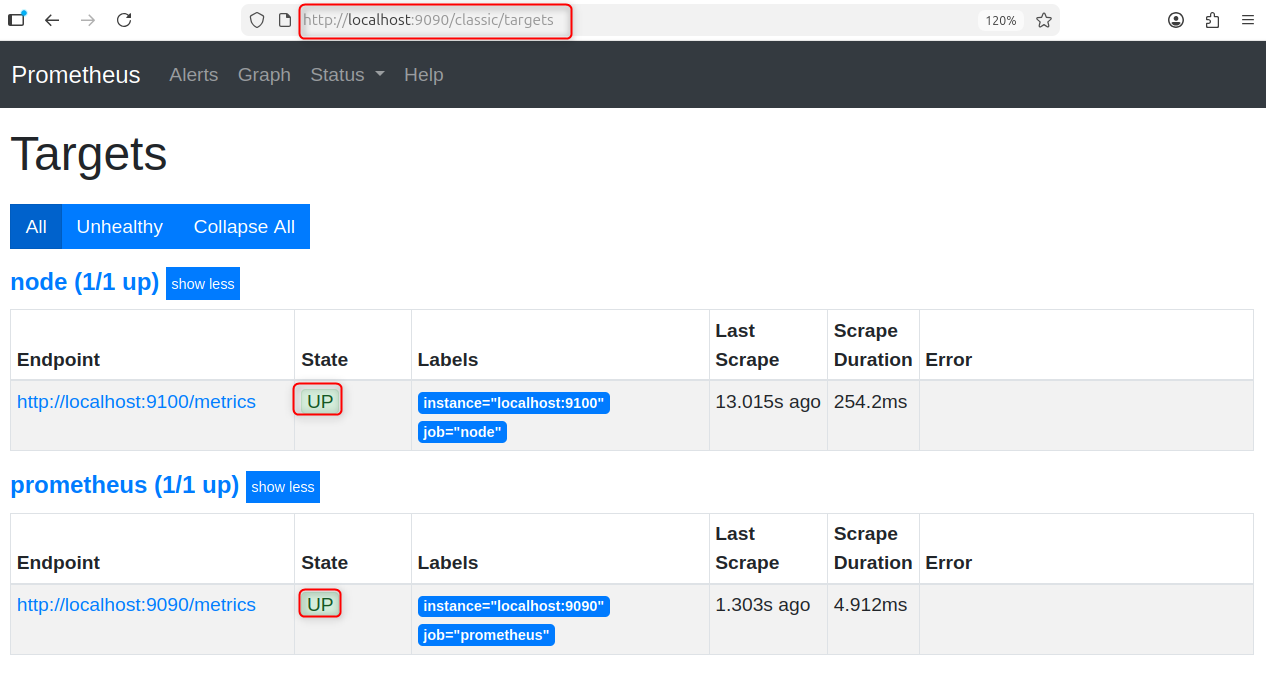
- Targets page: (http://localhost:9090/targets)
Shows all the targets that are configured and their current health status. Once scraping starts, both Prometheus and node targets should display a green UP sign. A DOWN target indicates that Prometheus can’t access that endpoint.

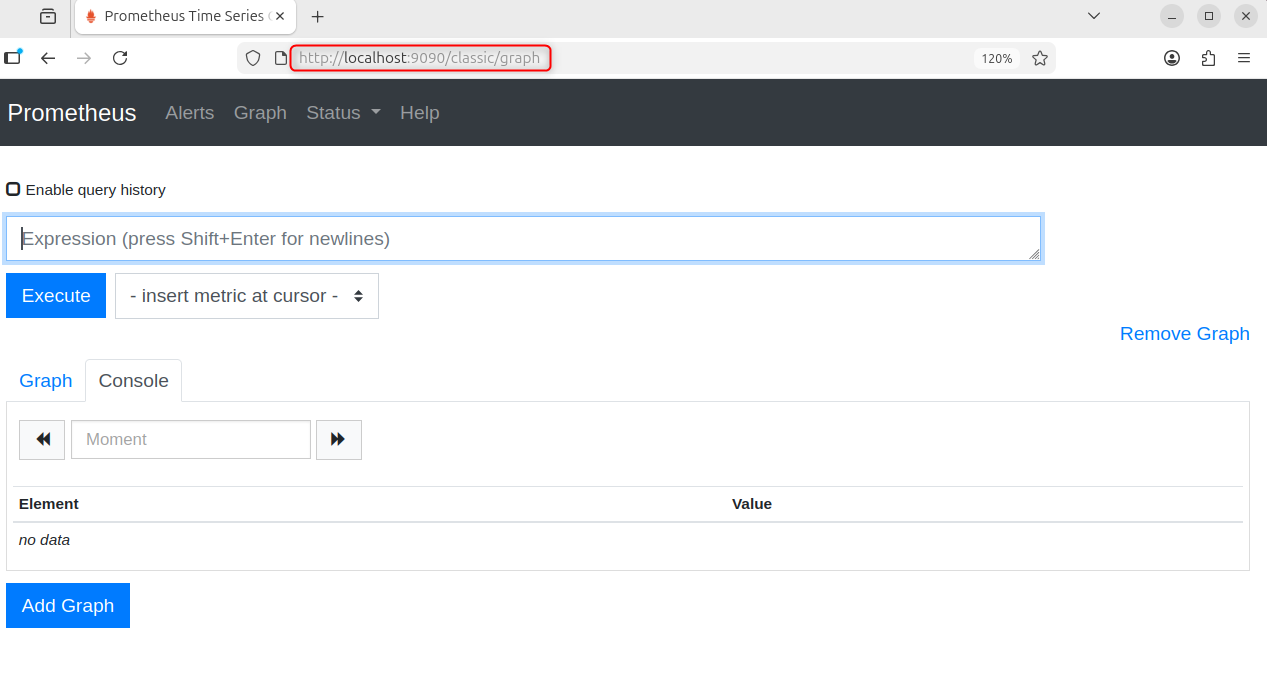
- Graph page: (http://localhost:9090/graph)
The built-in expression browser, to run PromQL and display the results as a graph or as a table. This is the main screen that you’ll use to explore metrics before creating Grafana dashboards.
Step 8: Run PromQL Queries to Explore Your Metrics
PromQL (Prometheus Query Language) is the powerful query language you use to select, filter, and calculate metrics from the Prometheus time-series database. Run these queries in the Prometheus Graph page to explore your system metrics.
Check if Node Exporter is up:
|
up{job=”node”} |
|---|

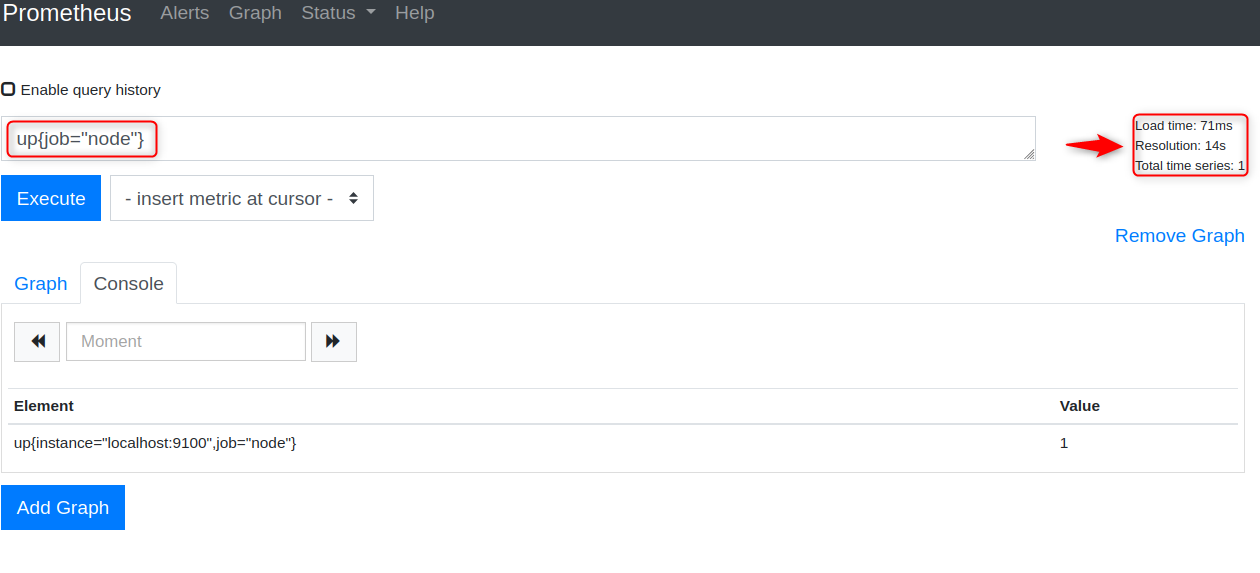
This returns 1 if the target is reachable and scraping successfully, or 0 if it is down.
CPU usage percentage across all cores:
|
100 – (avg by(instance)(rate(node_cpu_seconds_total{mode=”idle”}[5m])) * 100) |
|---|

![100 - (avg by(instance)(rate(node_cpu_seconds_total{mode="idle"}[5m])) * 100)](http://greenwebpage.com/community/wp-content/uploads/2026/05/word-image-16574-19.png)
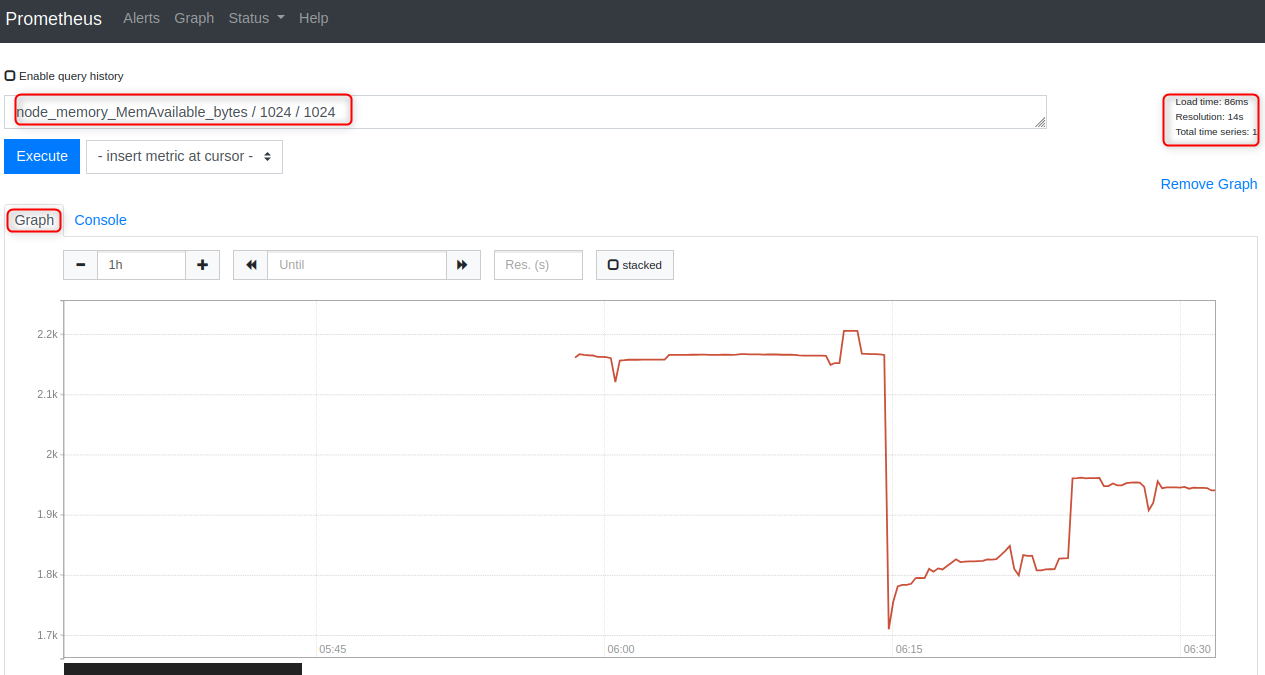
Available memory in megabytes:
|
node_memory_MemAvailable_bytes / 1024 / 1024 |
|---|

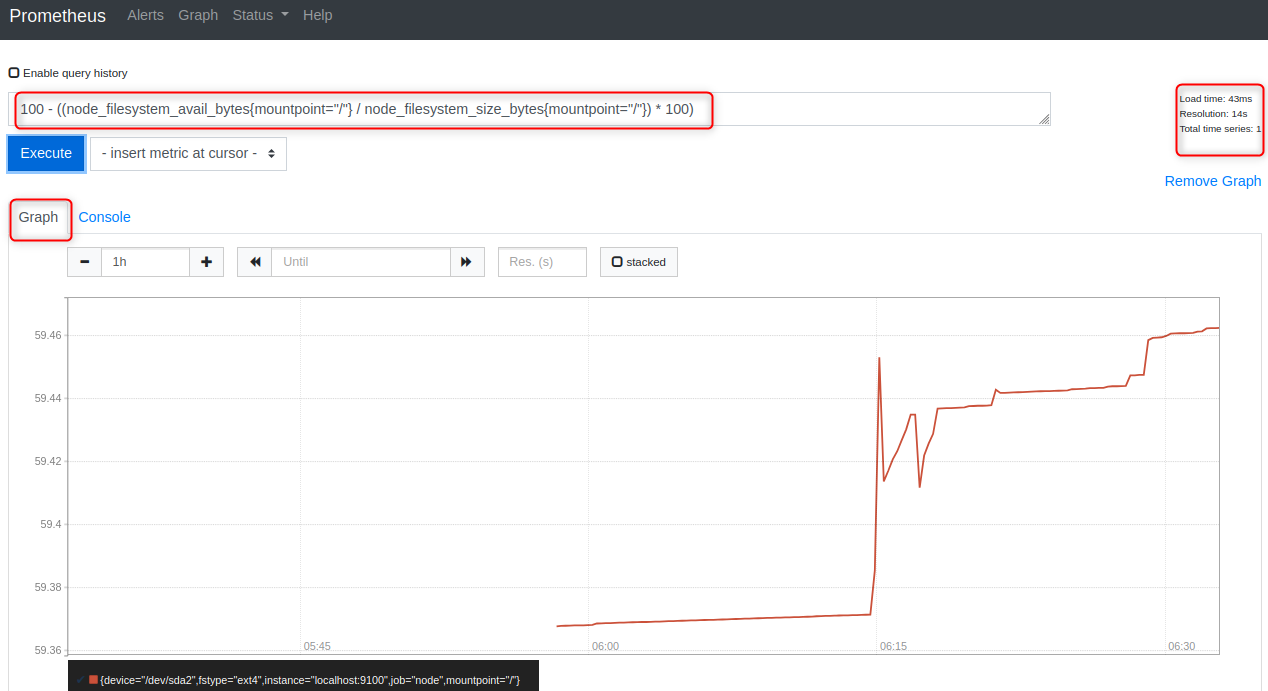
Disk space used percentage:
|
100 – ((node_filesystem_avail_bytes{mountpoint=”/”} / node_filesystem_size_bytes{mountpoint=”/”}) * 100) |
|---|

Network receive rate in KB/s:
|
rate(node_network_receive_bytes_total[5m]) / 1024 |
|---|

![rate(node_network_receive_bytes_total[5m]) / 1024](http://greenwebpage.com/community/wp-content/uploads/2026/05/word-image-16574-22.png)
All of these queries will return the actual values of your Ubuntu system, so you can know what your system is using at any time.
Troubleshooting Common Issues on Ubuntu
- No port 9090 is available: Make sure to see if it is blocked by your Ubuntu firewall (UFW). Open Prometheus and Node Exporter ports by running sudo ufw allow 9090/tcp and sudo ufw allow 9100/tcp.
- If the Node Exporter target is DOWN in Prometheus UI, execute sudo systemctl status prometheus-node-exporter to make sure Node Exporter is running. If it is stopped, then start it using sudo systemctl start prometheus-node-exporter and check whether the metrics endpoint is responding using curl http://localhost:9100/metrics.
- If Prometheus does not start after editing prometheus.yml, you can validate the syntax of the YAML file before retrying the service using promtool check config /etc/prometheus/prometheus.yml. This will indicate the exact line number on which the syntax error is found.
- Grafana data source test fails: This typically occurs when Grafana is installed on a different server than Prometheus, or there is a firewall in the way. Make sure that the Prometheus URL entered in Grafana is accessible from the Grafana server, and port 9090 is open.
- Prometheus uses a lot of memory: Prometheus stores 15 days of metrics by default. When space is an issue, minimize storage by editing /etc/default/prometheus and updating ARGS to: –storage.tsdb.retention.time=7d, and restarting the service.
Best Practices for Prometheus Monitoring on Ubuntu
With these in mind, you can be sure that your monitoring stack is reliable and secure in production:
- Set up a separate Prometheus user. The Ubuntu package installer automatically creates a Prometheus user for both the Prometheus server and the Node Exporter, which gives them limited system privileges, making attacks less likely to succeed if either service is compromised.
- Version control configuration files. Just as you do with application code, store prometheus.yml in a git repository and have a complete history of all changes to your monitoring configuration.
- Create alerting rules in advance. Prometheus integrates with Alertmanager to send notifications when metrics reach thresholds defined in Alertmanager. Set CPU, memory, and disk alerts in advance, not after an incident.
- Monitor Prometheus itself. The default is to also scrape Prometheus’s own metrics (job_name: ‘prometheus’), so you’ll be able to alert if Prometheus is using a lot of memory, or if the duration of the scraps is increasing unexpectedly.
- Apply recording rules to costly queries. For complex PromQL queries that Grafana executes on each refresh of the dashboard, create these queries as recording rules in Prometheus, rather than using Grafana to query them on the fly, which increases the latency of your queries.
Conclusion
Setting up Prometheus involves downloading the binary, configuring the prometheus.yml file to define scrape targets, and running the server, which listens on port 9090. In this tutorial, you’ll learn how to install Prometheus monitoring on Ubuntu 24.04 LTS to enable you to view your server as a fully observed system. You installed Prometheus 2.45.3 from the Ubuntu official repository and Node Exporter 1.7.0, configured both of them to run under systemd, and verified that 1,088 real metrics are being exposed and scraped. You wrote some PromQL queries to explore CPU, memory, disk, and network data.