If something breaks on your AlmaLinux 10 server, the logs almost always know why. AlmaLinux 10, built on the RHEL 10 codebase and running systemd 257, uses a dual logging architecture: the structured, binary systemd-journald system accessed through journalctl, and the traditional plain-text logs written by rsyslog into /var/log/. Knowing how to use both is essential for troubleshooting, security auditing, and day-to-day system administration.
This guide covers everything you need: monitoring event logs, reading and filtering logs with journalctl, navigating the key files in /var/log/, enabling persistent logging, monitoring logs in real time, and keeping log storage under control.
Table of Content
- Understanding AlmaLinux 10’s Dual Logging System
- How to Monitor Logs in AlmaLinux 10 (journalctl & /var/log/)
- Part 1: Monitoring Logs with journalctl
- Part 2: Enabling Persistent Journal Storage
- Part 3: Monitoring Logs in /var/log/
- Part 4: Managing Log Size and Disk Usage
- Part 5: Exporting and Integrating Logs
- Quick Reference: Most-Used Commands
- Final Thoughts
- FAQs
Understanding AlmaLinux 10’s Dual Logging System
AlmaLinux 10 doesn’t rely on a single logging tool: it runs two complementary systems side by side:
- systemd-journald: Always running, it captures structured logs from the kernel, the boot process, and every systemd service, and stores them in binary format.
- rsyslog: reads from journald (via the imjournal module) and writes traditional, human-readable text files into /var/log/and can forward logs to a remote syslog server or SIEM.
Note: journalctl gives you powerful filtering and querying, while /var/log/ gives you portable, greppable text files. Most experienced admins use both depending on the task.
How to Monitor Event Logs in AlmaLinux 10 (journalctl & /var/log/)
Monitor logs in AlmaLinux 10 using journalctl for systemd logs and /var/log/ for traditional log files. Learn how to view, filter, monitor, and manage system logs to troubleshoot errors, check service activity, and maintain system performance. This guide covers essential commands for effective Linux log monitoring and administration.
Part 1: Monitoring Logs with journalctl
Viewing All Logs
The simplest way to browse the journal is:
journalctl |
|---|

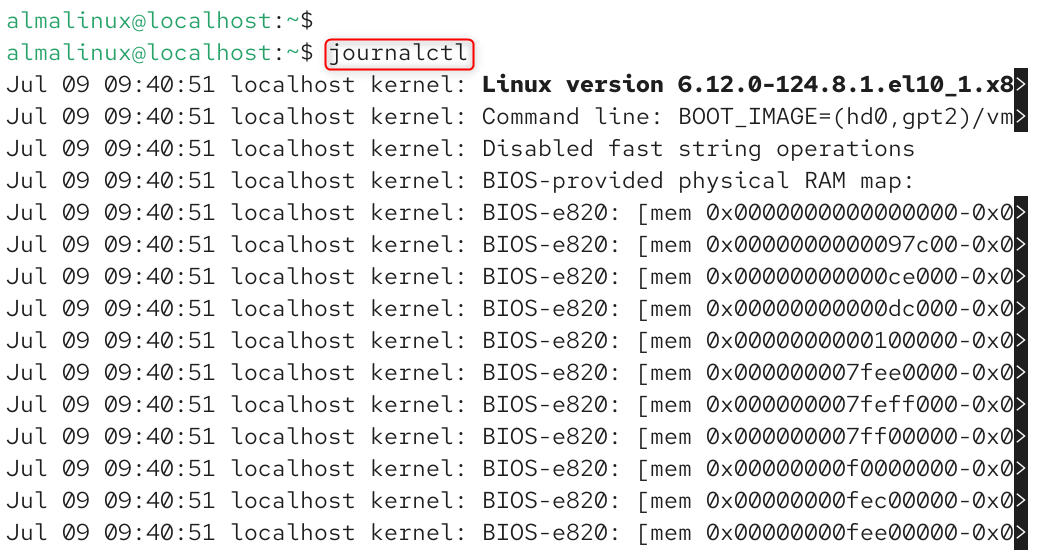
This opens the full log history in a pager (press q to quit, arrow keys to scroll). Since this can be enormous on a busy server, you’ll almost always want to filter it.
Following Logs in Real Time
To watch logs as they happen, similar to tail -f: use the -f flag:
journalctl -f |
|---|

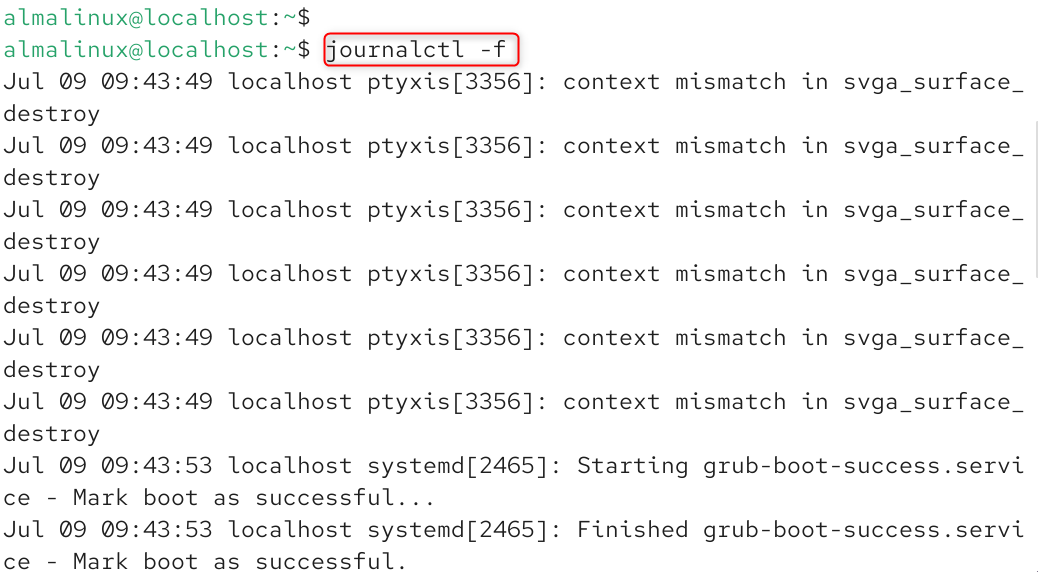
This is the command you’ll reach for most often when debugging a live issue, such as watching what happens the moment a service crashes or a login attempt fails.
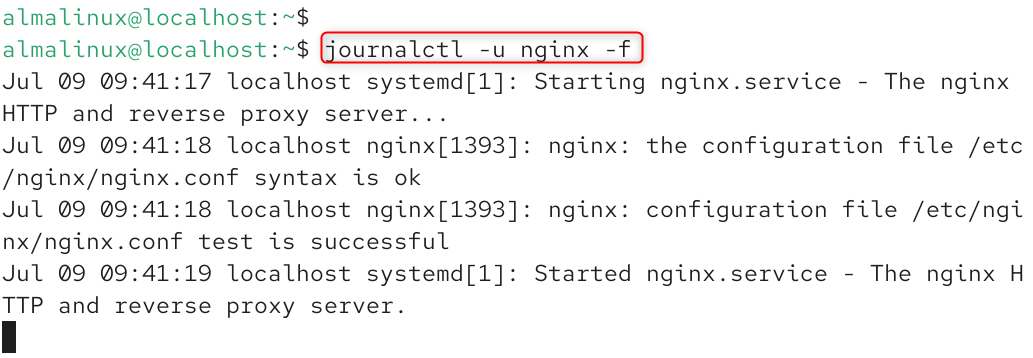
You can also follow a specific service, such as the Nginx web server:
journalctl -u nginx -f |
|---|

Filtering Logs by Service (Unit)
To see logs for one specific systemd service:
journalctl -u sshd journalctl -u httpd journalctl -u firewalld |
|---|

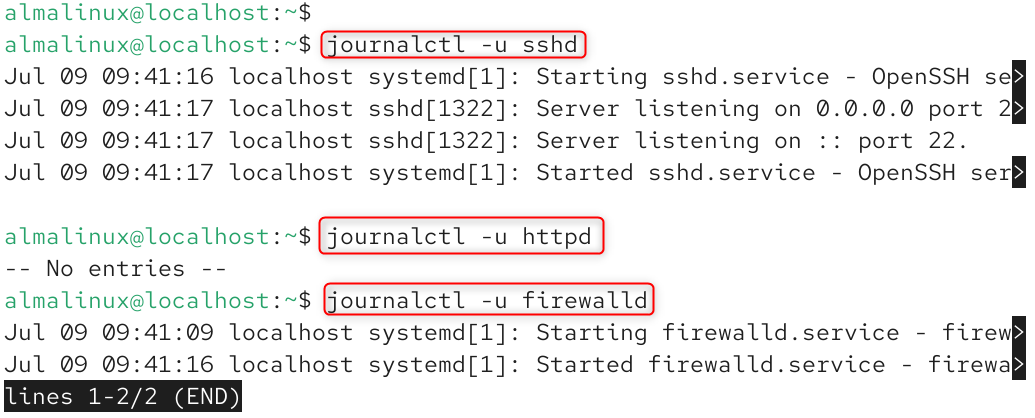
This is far faster than scanning /var/log/messages manually when you already know which service is misbehaving.
Filtering Logs by Time
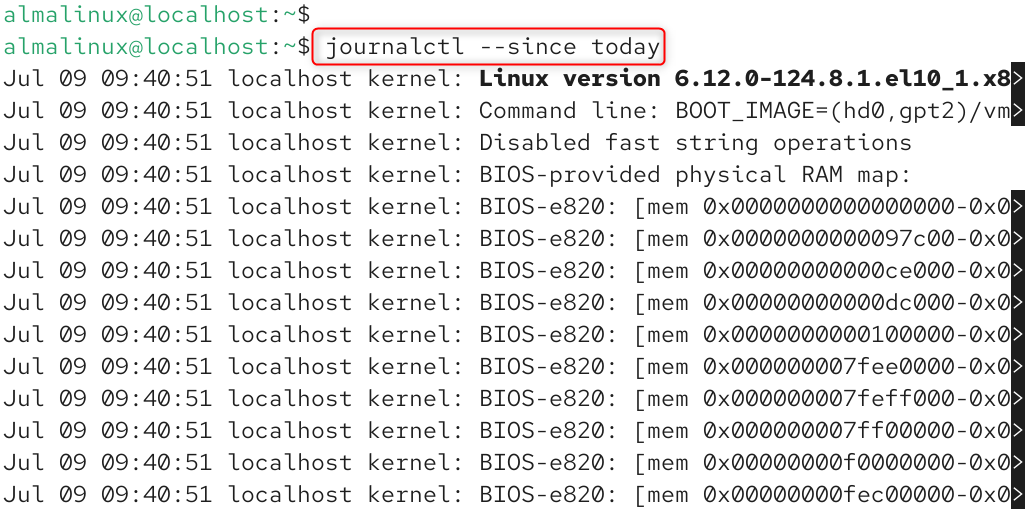
journalctl supports flexible, human-readable time filters:
journalctl –since today |
|---|

Filtering Logs by Priority Level
Every log entry carries a severity level, from emerg (0) to debug (7). To only see errors and above:
journalctl -p err |
|---|

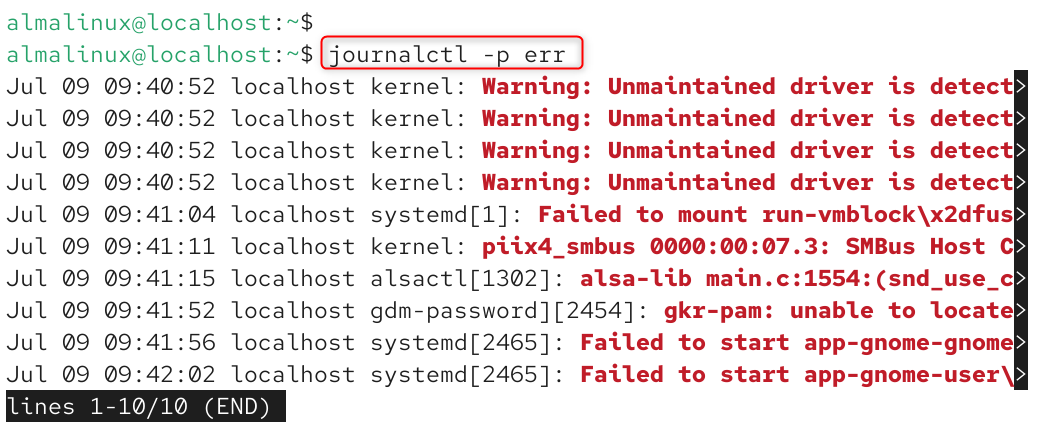
Available priority names: emerg, alert, crit, err, warning, notice, info, debug.
Viewing Logs by Boot Session
To troubleshoot a crash or unexpected reboot, list all recorded boots:
journalctl –list-boots |
|---|


Then view logs from a specific boot (0 = current, -1 = previous):
journalctl -b -1 |
|---|


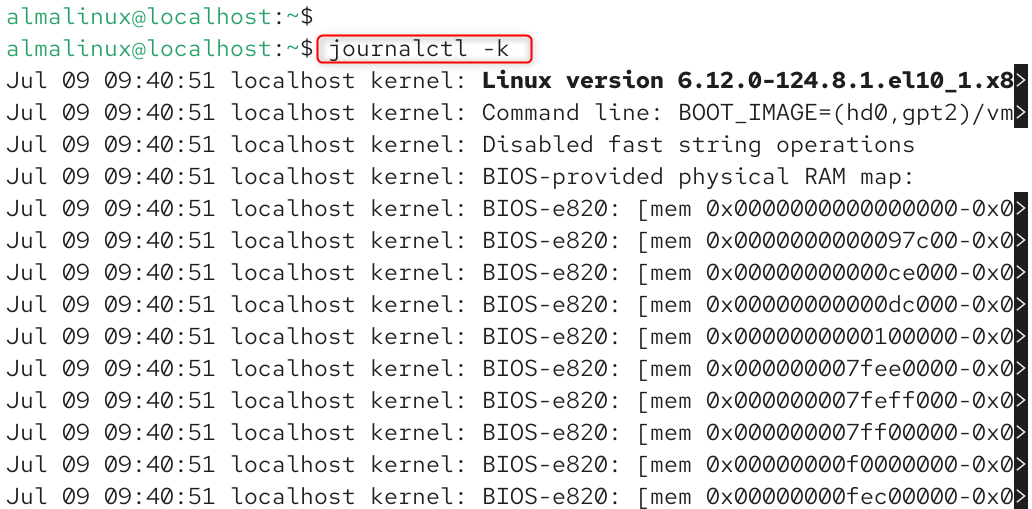
Viewing Kernel Messages
To see kernel-level messages only (hardware, drivers, low-level errors):
journalctl -k |
|---|

Combining Filters
Filters can be chained for precise results: for example, SSH errors from the last hour:
journalctl -u sshd –since “1 hour ago” -p err |
|---|


Part 2: Enabling Persistent Journal Storage
By default, AlmaLinux 10 may store journal logs only in a temporary filesystem (/run/log/journal/), meaning they’re wiped on every reboot. For production servers, you want persistent, on-disk logging.
Check where your journal is currently stored:
journalctl –header |
|---|

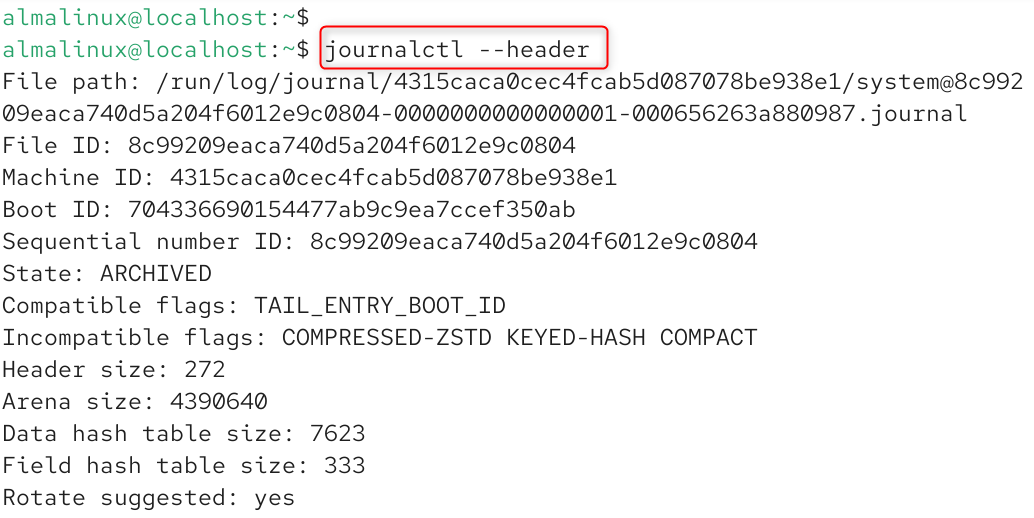
If the file path shown starts with /run/log/journal/, your logs are volatile. To make them persistent:
sudo mkdir -p /var/log/journal sudo systemctl restart systemd-journald |
|---|


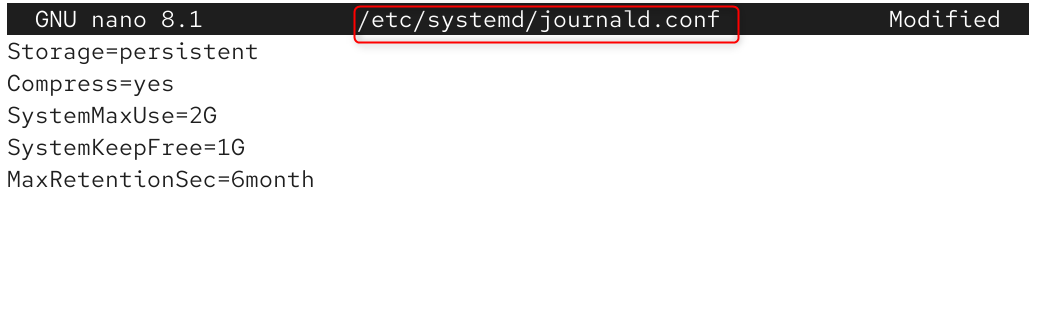
For finer control, edit the journald configuration file:
sudo nano /etc/systemd/journald.conf |
|---|
Set the following values:
Storage=persistent Compress=yes SystemMaxUse=2G SystemKeepFree=1G MaxRetentionSec=6month |
|---|

Restart the service to apply changes:
sudo systemctl restart systemd-journald |
|---|


Part 3: Monitoring Logs in /var/log/
While journalctl is powerful, plain-text logs in /var/log/ remain useful for quick greps, legacy tooling, and long-term archives. Key files to know on AlmaLinux 10:
Log File | Description |
|---|---|
/var/log/messages | General system messages and events |
/var/log/secure | Authentication and login attempts (critical for security monitoring) |
/var/log/cron | Cron job execution history |
/var/log/maillog | Mail server activity |
/var/log/audit/audit.log | SELinux and auditd security events |
/var/log/httpd/ or /var/log/nginx/ | Web server access and error logs |
Viewing and Following Text Logs
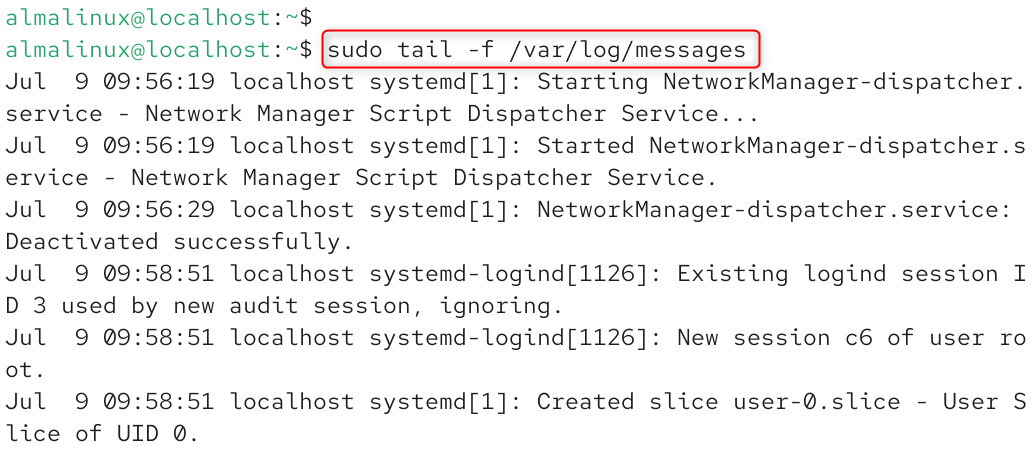
To watch general system activity in real time:
sudo tail -f /var/log/messages |
|---|

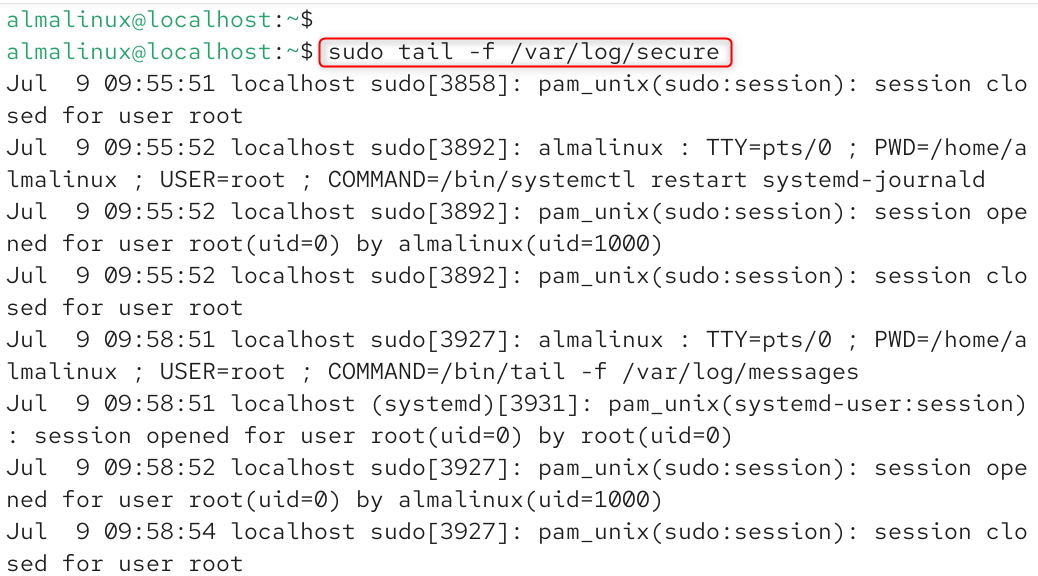
To monitor authentication attempts (useful for spotting brute-force login attempts):
sudo tail -f /var/log/secure |
|---|

To search historical logs for a keyword:
grep -i “failed password” /var/log/secure |
|---|


Checking rsyslog Status and Configuration
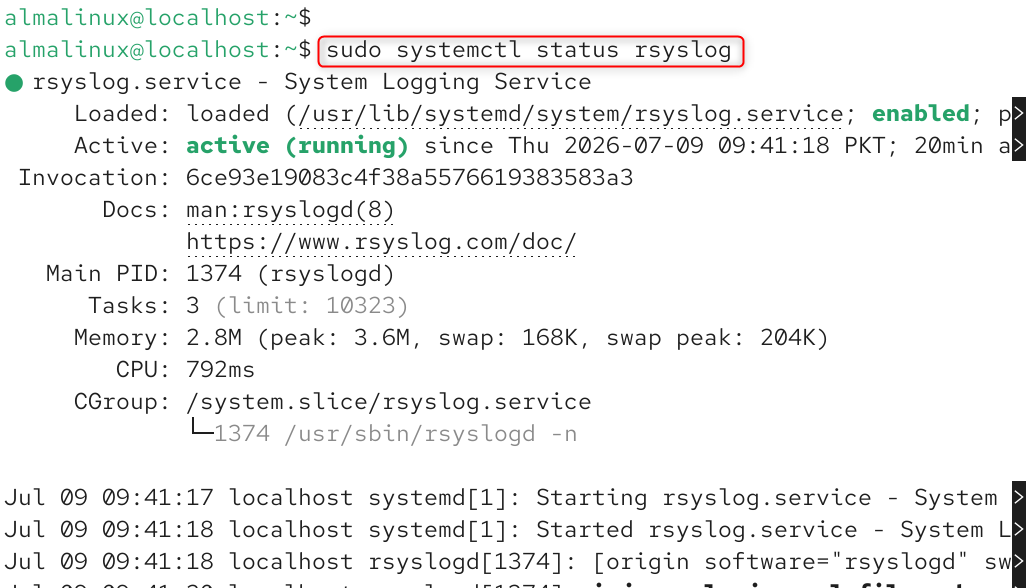
Confirm rsyslog is running:
sudo systemctl status rsyslog |
|---|

View its main configuration:
cat /etc/rsyslog.conf |
|---|

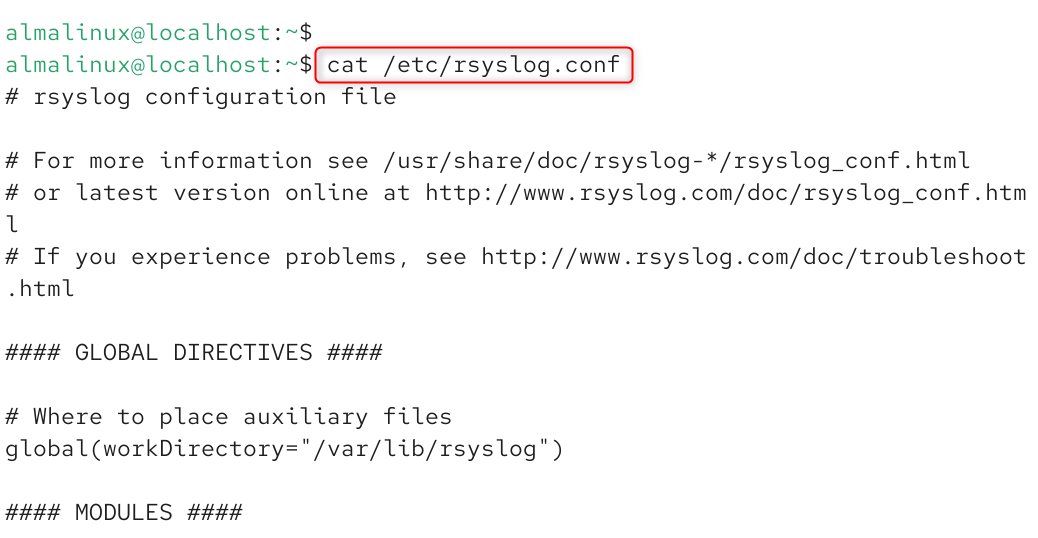
Always place custom rules in /etc/rsyslog.d/ (e.g., 99-custom.conf) rather than editing rsyslog.conf directly, so your changes survive package updates.
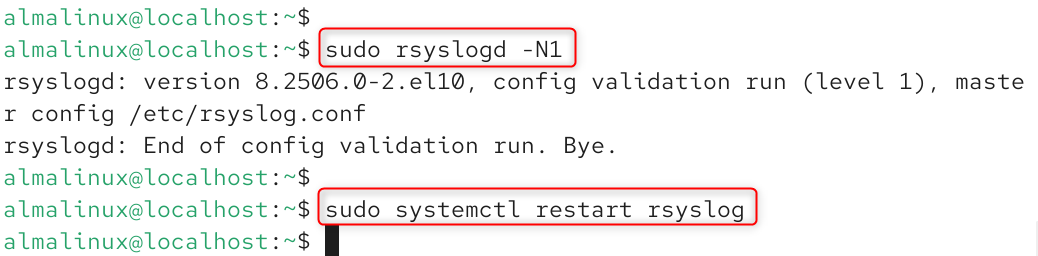
Test configuration syntax before restarting:
sudo rsyslogd -N1 sudo systemctl restart rsyslog |
|---|

Part 4: Managing Log Size and Disk Usage
Unmanaged logs can quietly fill your disk on a busy AlmaLinux 10 server. Check journal disk usage:
journalctl –disk-usage |
|---|


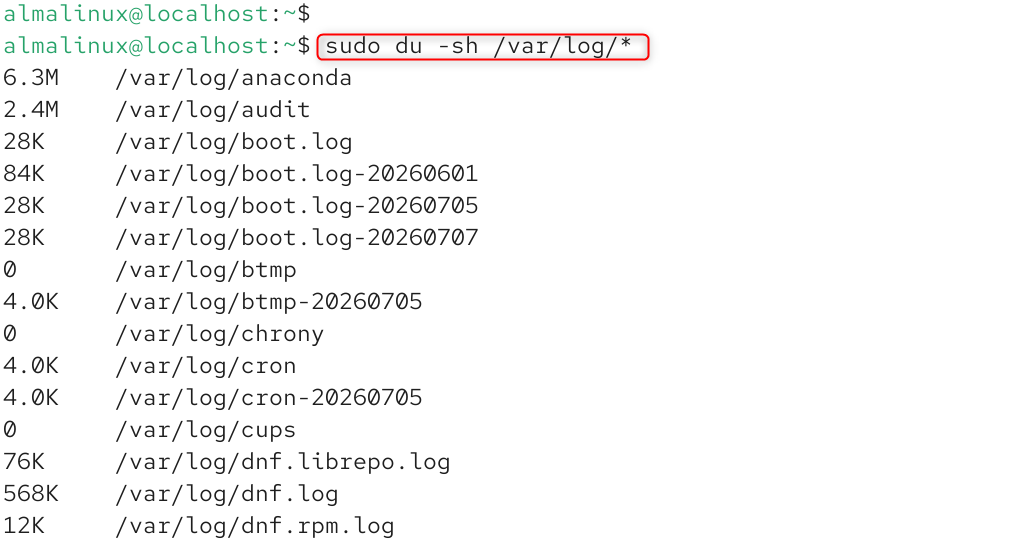
Check the size of everything under /var/log/:
sudo du -sh /var/log/* |
|---|

Cleaning Up Old Journal Logs
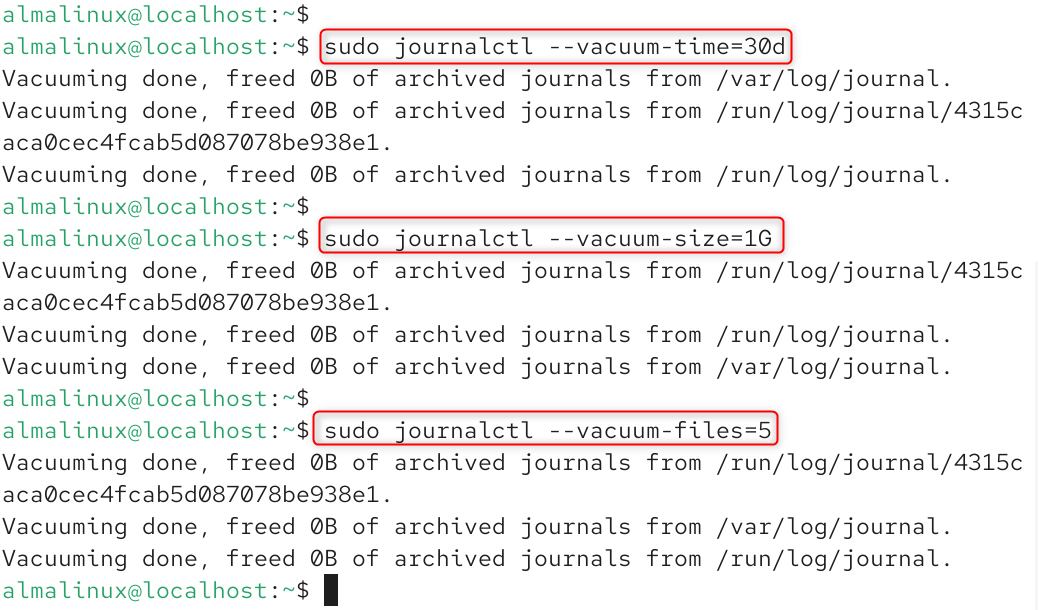
Use the –vacuum-* flags to reclaim space safely:
sudo journalctl –vacuum-time=30d # keep only the last 30 days sudo journalctl –vacuum-size=1G # shrink journal to under 1GB sudo journalctl –vacuum-files=5 # keep only the 5 most recent journal files |
|---|

Text logs under /var/log/ are typically rotated automatically by logrotate, configured in /etc/logrotate.conf and /etc/logrotate.d/.
Part 5: Exporting and Integrating Logs
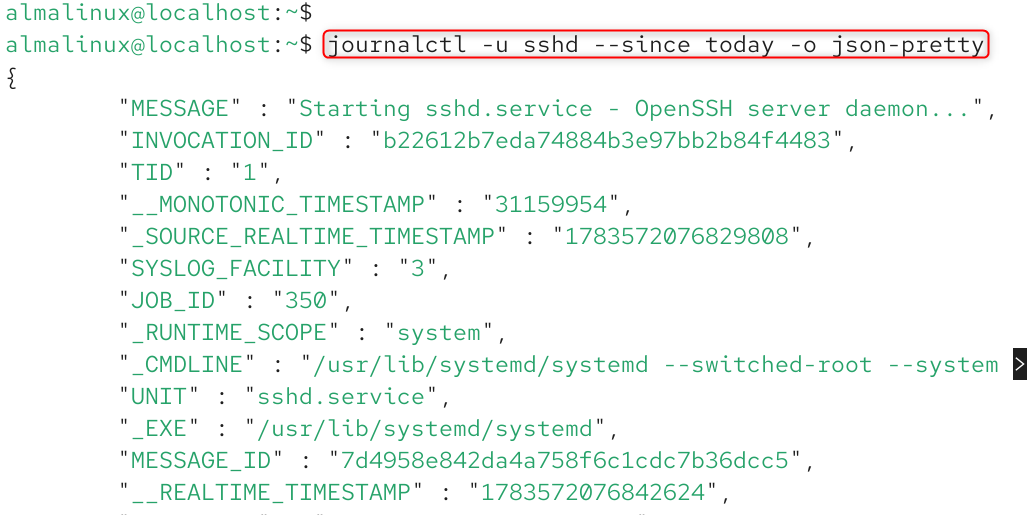
For centralized monitoring or SIEM integration, journalctl can export structured JSON output that tools like jq, Elasticsearch, or custom scripts can parse:
journalctl -u sshd –since today -o json-pretty |
|---|

If you’re forwarding logs to a remote log server, rsyslog handles that through its imjournal and forwarding modules: a common setup for teams running centralized logging with the ELK stack or a dedicated syslog server.
Quick Reference: Most-Used Commands
Command | Description |
|---|---|
journalctl -f | Follow logs live (similar to tail -f) |
journalctl -u <service> –since today | Show today’s logs for a specific service |
journalctl -p err | Display error-level logs and more severe messages |
journalctl –disk-usage | Check the current journal log size usage |
tail -f /var/log/secure | Watch login attempts live |
sudo journalctl –vacuum-time=30d | Clean up journal logs older than 30 days |
Final Thoughts
To monitor logs on AlmaLinux 10, use journalctl for live and filtered systemd events, or use traditional tools like cat, less, and tail for plain-text log files in /var/log/. Monitoring logs on AlmaLinux 10 comes down to knowing which tool fits the job: journalctl for fast, structured filtering by service, time, or severity, and /var/log/ for portable text files, security audits, and integration with older tooling.
Enabling persistent journal storage early, keeping an eye on disk usage, and getting comfortable with journalctl -f will cover the vast majority of day-to-day troubleshooting you’ll do as an AlmaLinux administrator.
FAQs
1. How do I check system logs in AlmaLinux 10 using journalctl?
Use the journalctl command to view and analyze systemd logs in AlmaLinux 10. Run journalctl -xe to check recent errors and system events.
2. Where are log files stored in AlmaLinux 10?
Most traditional Linux log files are stored in the /var/log/ directory, including system logs, authentication logs, and service-related logs.
3. Can Prometheus Monitor Logs?
Prometheus mainly monitors metrics, not logs. For log monitoring, it is commonly used with tools like Grafana Loki or Elasticsearch.
4. What Are Azure Monitor Logs?
Azure Monitor Logs is a service in Microsoft Azure Monitor that collects and analyzes logs from Azure resources for troubleshooting and performance monitoring.
5. How Does Azure Monitor Logs Query Work?
Azure Monitor Logs Query uses Kusto Query Language (KQL) to search, filter, and analyze log data stored in Log Analytics workspaces.